Story Highlights
- Sixth consecutive month of $100+ spending averages
- Highest spending average since May 2008
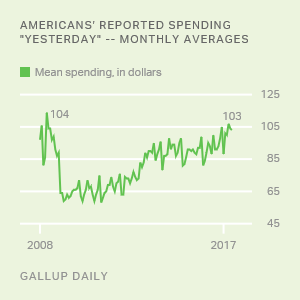
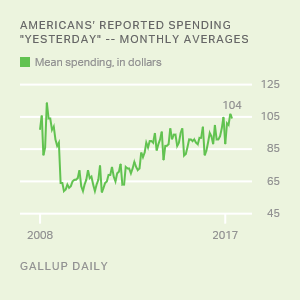
WASHINGTON, D.C. -- Americans' daily self-reports of spending averaged $109 in July, the sixth month in a row in which spending has averaged $100 or more. This is the highest spending average in Gallup's trend since May 2008.
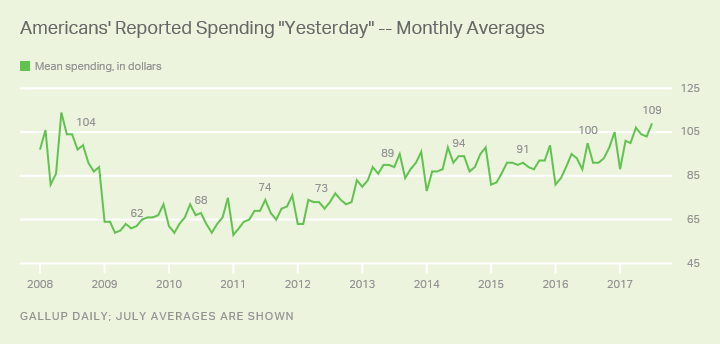
The July average is based on more than 14,000 interviews conducted as part of Gallup Daily tracking throughout the month. Gallup asks Americans each night to report how much they spent the previous day, excluding spending on normal household bills and major purchases such as a home or car. The measure gives an indication of discretionary spending.
The $6 increase from June is not statistically significant. In most years, spending showed little or no change from June to July, though there was a sizable $12 increase in 2016. The latest average is the highest for the month of July in Gallup's tracking.
| July | August | Change | |||||||||||||||||||||||||||||||||||||||||||||||||||||||||||||||||||||||||||||||||||||||||||||||||
|---|---|---|---|---|---|---|---|---|---|---|---|---|---|---|---|---|---|---|---|---|---|---|---|---|---|---|---|---|---|---|---|---|---|---|---|---|---|---|---|---|---|---|---|---|---|---|---|---|---|---|---|---|---|---|---|---|---|---|---|---|---|---|---|---|---|---|---|---|---|---|---|---|---|---|---|---|---|---|---|---|---|---|---|---|---|---|---|---|---|---|---|---|---|---|---|---|---|---|---|
| $ | $ | $ | |||||||||||||||||||||||||||||||||||||||||||||||||||||||||||||||||||||||||||||||||||||||||||||||||
| 2016 | 100 | 91 | -9 | ||||||||||||||||||||||||||||||||||||||||||||||||||||||||||||||||||||||||||||||||||||||||||||||||
| 2015 | 91 | 89 | -1 | ||||||||||||||||||||||||||||||||||||||||||||||||||||||||||||||||||||||||||||||||||||||||||||||||
| 2014 | 94 | 94 | 0 | ||||||||||||||||||||||||||||||||||||||||||||||||||||||||||||||||||||||||||||||||||||||||||||||||
| 2013 | 89 | 95 | +6 | ||||||||||||||||||||||||||||||||||||||||||||||||||||||||||||||||||||||||||||||||||||||||||||||||
| 2012 | 73 | 77 | +4 | ||||||||||||||||||||||||||||||||||||||||||||||||||||||||||||||||||||||||||||||||||||||||||||||||
| 2011 | 74 | 68 | -6 | ||||||||||||||||||||||||||||||||||||||||||||||||||||||||||||||||||||||||||||||||||||||||||||||||
| 2010 | 68 | 63 | -5 | ||||||||||||||||||||||||||||||||||||||||||||||||||||||||||||||||||||||||||||||||||||||||||||||||
| 2009 | 62 | 65 | +3 | ||||||||||||||||||||||||||||||||||||||||||||||||||||||||||||||||||||||||||||||||||||||||||||||||
| 2008 | 104 | 97 | -7 | ||||||||||||||||||||||||||||||||||||||||||||||||||||||||||||||||||||||||||||||||||||||||||||||||
| Gallup Daily | |||||||||||||||||||||||||||||||||||||||||||||||||||||||||||||||||||||||||||||||||||||||||||||||||||

Gallup Analytics
Subscribe to our online platform and access nearly a century of primary data.
Spending Among Higher-, Lower-Income Americans Up Slightly
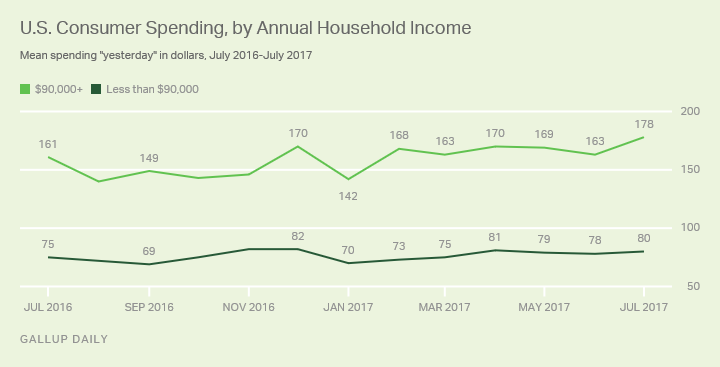
Spending among both higher- and lower-earning Americans was slightly up in July and is among the highest in Gallup's recent trend. Higher earners' spending has consistently been more than double that of lower earners.
Adults in households whose annual income is $90,000 or more reported a spending average of $178 throughout July. Meanwhile, spending among Americans in households earning less than $90,000 annually averaged $80.
Bottom Line
With six consecutive months of average daily spending at or above $100, Americans' spending levels are back to where they were before the global financial crisis in 2008, and the latest figure is the second-highest average in nearly a decade of Gallup's tracking. The elevated spending levels are stable among both higher- and lower-earning Americans.
This is a strong start for the second half of 2017, but given August's propensity for flat or lower spending, Americans' relatively high spending average in July is not likely to hold.
These data are available in Gallup Analytics.
Survey Methods
Results for this Gallup poll are based on telephone interviews conducted July 1-30, 2017, on the Gallup U.S. Daily survey, with a random sample of 14,710 adults, aged 18 and older, living in all 50 U.S. states and the District of Columbia. The margin of error for the spending mean is ±$6. All reported margins of sampling error include computed design effects for weighting.
Each sample of national adults includes a minimum quota of 70% cellphone respondents and 30% landline respondents, with additional minimum quotas by time zone within region. Landline and cellular telephone numbers are selected using random-digit-dial methods.
Learn more about how the Gallup U.S. Daily works.