GALLUP NEWS SERVICE
PRINCETON, NJ -- Americans express a spectrum of views on gay rights, ranging from near universal support for gay rights in the workplace to majority opposition of legalizing gay marriage. In between, slim majorities say homosexual relations should be legal and support homosexuality as an acceptable alternative lifestyle. The broad picture is one of mixed feelings about the issue.
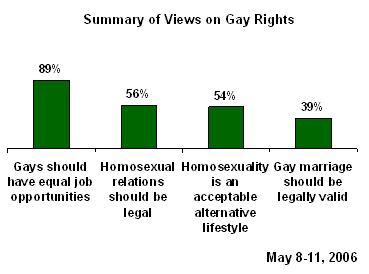
However, Americans aren't so much ambiguous in their attitudes on gay rights as they are culturally fractured. Younger women (those under 50 years old), self-described "liberals," and non-religious Americans are widely tolerant of societal acceptance of gays. Seniors, older men (those 50 years old or older), self-described "conservatives," and highly religious Americans are mostly resistant to this cultural shift.
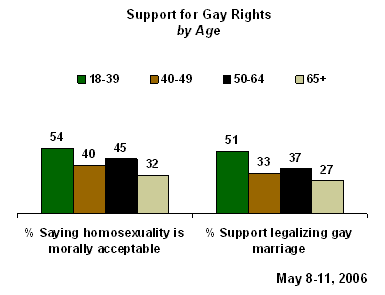
At the root of these differences are big gaps in the perceived morality of homosexuality. Overall, only 44% of Americans say homosexuality is morally acceptable while 51% say it is morally wrong. However, across society such expressed tolerance ranges from 74% among liberal Americans to 18% among frequent churchgoers. A strong generational split is also evident, as only one-third (32%) of seniors say it is morally acceptable, compared with a majority (54%) of those under 40 years old.
|
Perceived Morality of Homosexual Relations |
|||
|
% Saying |
% Saying |
Net acceptable |
|
|
National adults |
44 |
51 |
-7 |
|
|
|
|
|
|
Liberal |
74 |
23 |
+51 |
|
Seldom/Never worship |
64 |
31 |
+33 |
|
Women ages 18 to 49 |
55 |
41 |
+14 |
|
All 18- to 39-year-olds |
54 |
43 |
+11 |
|
Democratic |
52 |
45 |
+7 |
|
Moderate |
50 |
44 |
+6 |
|
Independent |
50 |
44 |
+6 |
|
All 50- to 64-year-olds |
45 |
51 |
-6 |
|
Women ages 50 or older |
41 |
53 |
-12 |
|
Men ages 18 to 49 |
42 |
56 |
-14 |
|
Worship nearly weekly |
41 |
55 |
-14 |
|
All 40- to 49-year-olds |
40 |
58 |
-18 |
|
Men ages 50 or older |
35 |
59 |
-24 |
|
All 65-year-olds or older |
32 |
61 |
-29 |
|
Republican |
30 |
67 |
-37 |
|
Conservative |
28 |
69 |
-41 |
|
Worship weekly |
18 |
79 |
-61 |
The groups at either end of this tolerance spectrum are fairly consistent in their views about gay rights. Virtually everyone agrees that gays should have equal job opportunities, but only small minorities of weekly churchgoers, conservatives, or Republicans favor gay marriage or say homosexuality should be legal or that it should be considered an acceptable alternative lifestyle. Fewer than half of men aged 50 years old or older and all 40- to 49-year-old Americans hold these views, as well.
|
Groups Consistently Opposing Gay Rights |
|||
|
% Saying homosexual relations should be legal |
% Saying homosexuality is an acceptable alternative lifestyle |
% Saying gay marriage should be legally valid |
|
|
Worship weekly |
31 |
33 |
20 |
|
Conservative |
36 |
37 |
18 |
|
Republican |
37 |
38 |
19 |
|
All 65-year-olds or older |
34 |
38 |
27 |
|
Men ages 50 or older |
48 |
47 |
32 |
|
All 40- to 49-year-olds |
49 |
44 |
33 |
At the other extreme, about three-quarters of liberals support gay rights in each of these instances, as do at least half of infrequent churchgoers, women under 50, all younger adults (18- to 39-year-olds), and Democrats.
|
Groups Consistently Supporting Gay Rights |
|||
|
% Saying homosexual relations should be legal |
% Saying homosexuality is an acceptable alternative lifestyle |
% Saying gay marriage should be legally valid |
|
|
Liberal |
82 |
77 |
73 |
|
Seldom/Never worship |
71 |
67 |
51 |
|
Women ages 18 to 49 |
62 |
62 |
55 |
|
All 18- to 39-year-olds |
63 |
62 |
51 |
|
Democratic |
64 |
64 |
53 |
The cultural fence sitters -- those who support gay rights in some instances, but not in others -- include political moderates, independents, younger men, older women, 50- to 64-year-olds, and those who worship on a frequent but not weekly basis. For the most part, a majority of these groups think homosexual relations should be legal and say it should be considered an acceptable lifestyle, but do not think marriages between homosexuals should be recognized by the law as valid, with the same rights as traditional marriages.
|
Groups with Mixed Support for Gay Rights |
|||
|
% Saying homosexual relations should be legal |
% Saying homosexuality is an acceptable alternative lifestyle |
% Saying gay marriage should be legally valid |
|
|
Moderate |
68 |
66 |
47 |
|
Independent |
65 |
59 |
45 |
|
All 50- to 64-year-olds |
56 |
54 |
37 |
|
Women ages 50 or older |
53 |
54 |
32 |
|
Men ages 18 to 49 |
53 |
48 |
31 |
|
Worship nearly weekly/monthly |
57 |
54 |
44 |
A Stalled Agenda?
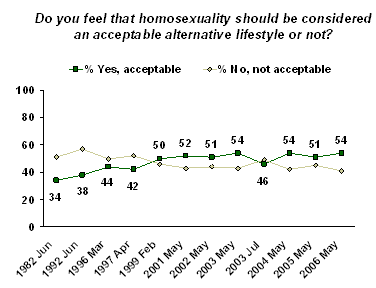
According to Gallup trends, public support for gay rights expanded considerably over the past three decades. This is seen in the percentage considering homosexuality an acceptable lifestyle, growing from 34% in 1982 to a majority by 2001. However, there has been little change in this over the last few years.
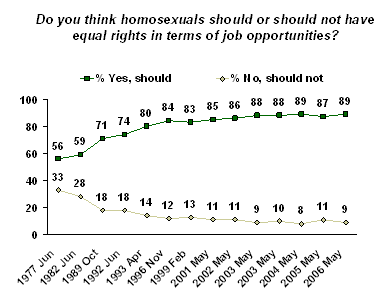
The same pattern is seen in attitudes about whether homosexual men and women should have equal rights in the workplace. Only 56% of Americans favored equal job rights for gays in 1977. This reached 88% in 2003 and has remained at about that level ever since.
Force in Numbers
Even if people's current views remain fixed, if the views of the next generation of young adults are at least as supportive of gay rights as are today's young adults, then the nation's moral compass is destined to shift even further than it has already in the direction of gay acceptance.
Young adults (18- to 39-year-olds) are the only age group where a majority considers homosexuality morally acceptable, and as a result they generally favor legal recognition for gay marriages. By contrast, barely one-quarter of seniors and only about one-third of middle-aged adults endorse this policy.
Survey Methods
These results are based on telephone interviews with a randomly selected national sample of 1,002 adults, aged 18 and older, conducted May 8-11, 2006. For results based on this sample, one can say with 95% confidence that the maximum error attributable to sampling and other random effects is ±3 percentage points. In addition to sampling error, question wording and practical difficulties in conducting surveys can introduce error or bias into the findings of public opinion polls.
