GALLUP NEWS SERVICE
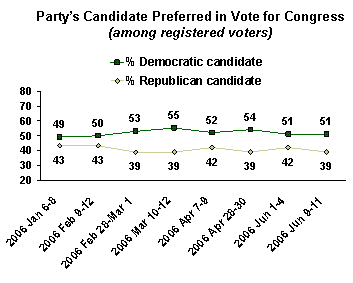
PRINCETON, NJ -- Less than five months from this year's midterm congressional elections, a June 9-11 USA Today/Gallup poll finds the Democrats leading the Republicans by 51% to 39% as the party registered voters say they plan to support in their local districts this November.
Republicans generally do better in midterm elections when turnout is taken into account using a "likely voter" model, something Gallup will not do until closer to the elections. But much can still be learned by comparing the vote preferences of the broad pool of registered voters today to the vote preferences of this group in previous elections.
Gallup's latest read on congressional voting intentions is the eighth this year. There are several ways to look at these data as an indicator of what might happen in the Nov. 7 elections. Most of them portend a strong showing for the Democrats this fall.
1. The Consistency of the Democratic Lead in '06
The current 12-point Democratic lead comes very close to the average 11-point lead the Democrats have held across the Gallup "generic ballot" measures conducted since the start of the year. More specifically, the Democrats have led the Republicans among registered voters by six or more points in every measure taken since January, and have led by nine or more points in every measure conducted since late February.

All of this suggests a degree of consistency to the Democrats' strength that, absent any major political or news events, might be expected to continue into the fall.
2. The Unusually Large Democratic Lead
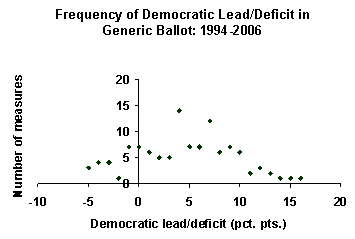
Gallup has conducted more than 100 measures of the generic ballot since 1994. This includes six congressional elections, starting with the one in which the Republican Party most recently captured majority control of the U.S. House of Representatives from the Democrats (1994), and the subsequent five when the GOP was able to retain that majority (1996, 1998, 2000, 2002, and 2004).
Across all of these measures, the Democrats have led the Republicans by 12 or more points among registered voters only eight times. Five of those instances have occurred in polling on the 2006 midterm elections (from late 2005 through today). The others include two polls conducted in October 1996 and one in September 1998.
The average Democratic performance in all 111 generic ballots conducted since 1994 has been a 4.5-point lead over the Republicans, with most of the results falling between a 1- and a 9-point Democratic lead. The Republicans have led among registered voters only a handful of times.

Thus, according to recent history, with an 11- to 12-point lead among registered voters, the Democrats are in an unusually strong position to do well in the fall.
3. An Auspicious Start
In most election years since 1994, Gallup has found a degree of consistency between the average Democratic lead in surveys conducted from January through June of each election year, and those conducted from July through November. In other words, the broad pattern established early in the year seems to persist through the summer and fall.
In most cases, the Democratic lead has not changed in either direction by more than five percentage points when comparing the first six months of the year to the remaining months leading up to the election. In five of the six cases, that lead has expanded rather than contracted.
|
Average Democratic Lead/Deficit in Generic Ballot |
|||
|
January-June |
July-November |
Change |
|
|
1994 |
2.5^ |
-1.3 |
-3.8 |
|
1996 |
2.7 |
7.3 |
4.6 |
|
1998 |
5.7 |
6.0 |
0.3 |
|
2000 |
3.5 |
4.7 |
1.2 |
|
2002 |
0.4 |
5.9 |
5.5 |
|
2004 |
-1.0* |
3.8 |
4.8 |
|
2006 |
11.1 |
||
|
^ 1994 January-June average based on only two measures |
|||
Still, it's important to note that the traditional Democratic lead among registered voters on the generic ballot almost always overstates the actual vote for Democratic candidates come Election Day. That's because Republicans typically have a disproportionately high turnout rate. Should the Democrats' average lead among registered voters shrink by four or five points, that would put the Republicans well within striking range of maintaining their majority status.
Of course, what's really important is where voters stand in the final pre-election poll in November. Last-minute events can produce changes in voter preferences. As seen in the accompanying table, however, in most cases the final Gallup generic ballot poll result has been similar to the average of the preceding months. (The major exception was in 1996, when the final poll was significantly less tilted toward the Democrats than the polls that preceded it.)
|
Democratic Lead/Deficit in Generic Ballot |
||
|
July-November |
Final |
|
|
1994 |
-1.3 |
0 |
|
1996 |
7.3 |
0 |
|
1998 |
6.0 |
7 |
|
2000 |
4.7 |
8 |
|
2002 |
5.9 |
5 |
|
2004 |
3.8 |
4 |
4. Exceptional Cases
The analysis presented here suggests the Democrats are likely to do well this fall, possibly capturing majority control of the U.S. House of Representatives. However, recent history does provide some examples of the Republicans recovering from double-digit deficits on the generic ballot and in the end retaining their congressional majority.
The strongest example of this is 1996 -- a presidential election year -- when the Republican Party fell behind the Democrats by 10 to 13 points on the generic ballot from about August through mid-October (with intermittent smaller deficits of 2 to 9 points). But this contracted to single digits by late October, and closed to a tie by Election Day. Republicans won that election with a 19-seat majority in the House -- a loss of 10 seats going into the election, but still a win.
In 1998, the Democrats led by 13 points in mid-September and 9 points in late October, yet the Republicans also narrowed the gap by November, and prevailed in that election with a 12-seat majority.
Implications
By virtue of Republicans' typically higher turnout in midterm elections, the Republican Party can expect to perform better this fall than is indicated by poll numbers based on registered voters. As noted, Gallup will not institute a "likely voter" model until closer to Election Day, but polling in previous years indicates the effect will be to narrow the Republican-Democratic gap by several points.
In recent elections, the Republican Party has trailed the Democrats in the final pre-election poll by as much as eight percentage points among all registered voters and still managed to win a majority of U.S. House seats in the election. It is unlikely, however, that the Republican majority could survive if the double-digit Democratic lead among registered voters -- as exists today -- persists into the final pre-election polling in late October and early November.
There is certainly time for the GOP to turn things around; as is said about the stock market, past performance is no guarantee of future earnings. Indeed, recent Gallup polling has detected some modest improvement in Americans' evaluations of the job Congress and President Bush are doing, as well as in their ratings of the economy and the Iraq war, although all remain decidedly negative. These are the important leading indicators to watch to determine whether the Democrats are likely to maintain their current advantage through the fall, or see it chipped away. Forthcoming analyses on gallup.com will discuss the relationship of these factors to the vote for Congress.
Survey Methods
These results are based on telephone interviews with a randomly selected national sample of 1,002 adults, aged 18 and older, conducted June 9-11, 2006. For results based on the total sample, one can say with 95% confidence that the maximum error attributable to sampling and other random effects is ±3 percentage points.
For results based on the sample of 930 registered voters, the maximum margin of sampling error is ±4 percentage points. In addition to sampling error, question wording and practical difficulties in conducting surveys can introduce error or bias into the findings of public opinion polls.
2. If the elections for Congress were being held today, which party's candidate would you vote for in your congressional district -- [ROTATED: the Democratic Party's candidate or the Republican Party's candidate]?
2A. As of today, do you lean more toward -- [ROTATE: the Democratic Party's candidate or the Republican Party's candidate]?
|
|
Democratic |
Republican |
Undecided/ |
|
Registered voters |
% |
% |
% |
|
2006 Jun 9-11 |
51 |
39 |
10 |
|
2006 Jun 1-4 |
51 |
42 |
7 |
|
2006 Apr 28-30 |
54 |
39 |
7 |
|
2006 Apr 7-9 |
52 |
42 |
6 |
|
2006 Mar 10-12 |
55 |
39 |
7 |
|
2006 Feb 28-Mar 1 |
53 |
39 |
7 |
|
2006 Feb 9-12 |
50 |
43 |
8 |
|
2006 Jan 6-8 |
49 |
43 |
8 |
|
2005 Oct 21-23 |
50 |
43 |
7 |
|
2005 Aug 28-30 |
53 |
41 |
6 |
|
|
|
|
|
|
National adults |
|
|
|
|
2006 Jun 9-11 |
52 |
38 |
10 |
|
2006 Jun 1-4 |
51 |
40 |
9 |
|
2006 Apr 28-30 |
53 |
38 |
9 |
|
2006 Apr 7-9 |
53 |
40 |
7 |
|
2006 Mar 10-12 |
54 |
38 |
8 |
|
2006 Feb 28-Mar 1 |
52 |
39 |
10 |
|
2006 Feb 9-12 |
49 |
42 |
9 |
|
2006 Jan 6-8 |
49 |
42 |
9 |
|
2005 Oct 21-23 |
50 |
42 |
8 |
|
2005 Aug 28-30 |
52 |
41 |
7 |
|
|
|
|
|
|
Regular voters ^ |
|
|
|
|
2006 Jun 9-11 |
49 |
44 |
7 |
|
2006 Jun 1-4 |
55 |
40 |
5 |
|
2006 Apr 28-30 |
53 |
44 |
3 |
|
2006 Apr 7-9 |
51 |
44 |
5 |
|
|
|
|
|
|
NOTE: Regular voters are defined as registered voters who say they "always vote" and who say they voted in the last midterm election. The regular voter sample consists of 514 respondents and has a margin of sampling error of ±5 percentage points. |
|||