GALLUP NEWS SERVICE
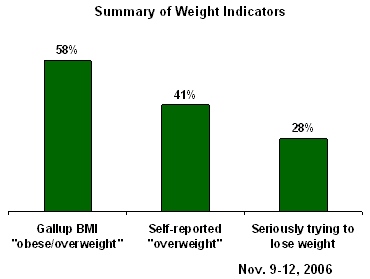
PRINCETON, NJ -- Gallup's annual Social Series Health and Healthcare survey suggests that fewer than half of overweight Americans are taking their weight situation very seriously as they head into the Thanksgiving holiday. According to their self-reported height and weight dimensions, 58% of U.S. adults appear to be overweight; however, only 28% are seriously trying to lose weight at this time. Part of the gap between problem and action is simply due to the failure of many overweight Americans to acknowledge they weigh more than they should; part is due to others not trying to lose their excess weight.
In the Nov. 9-12, 2006 survey, Gallup asked Americans to report their approximate height and weight, which was in turn used to calculate their Body Mass Index (BMI). On this basis, 20% of Americans can be classified as "obese," 38% as "overweight," 31% as "normal," and 6% as "underweight."
When asked about their weight status in the same survey, only 41% of Americans describe themselves as either "very overweight" or "somewhat overweight." A slight majority (53%) say they are "about right" while 5% say they are underweight.
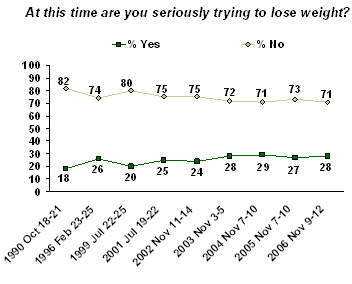
Even among the 41% who acknowledge they have a weight problem, about one-third are not working at losing weight. As noted, just 28% of Americans say they are seriously trying to lose weight right now, while 71% say they are not.

An Expanded Waistline
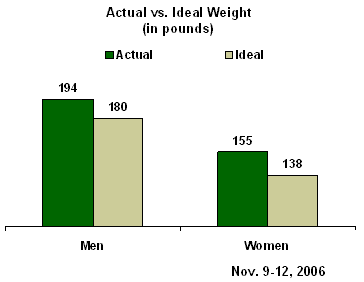
According to the Gallup survey, the average weight of men in the United States is 194 pounds. The average weight of women is 155 pounds. Americans weighed a bit less when Gallup first measured this in 1990. At that time, the average man weighed 180 and the average woman weighed 142. By 1999 these figures had jumped by 8 to 10 pounds, and today they are slightly higher. If there is any good news in the current poll, it is that for the past three years self-reported weight has been fairly stable.

Gallup also asked Americans what their ideal weight would be. Nearly two-thirds of Americans name a weight that is lower than their current weight. Only 18% indicate they are at their ideal weight while 10% name a weight that is higher.
For men, the average ideal weight named is 180 pounds and for women it is 138 pounds. Thus, to meet their goals, the average man needs to lose 14 pounds and the average woman needs to lose 17 pounds.

One trend Gallup has noticed over the years is Americans' concept of their ideal weight has increased by nearly the same amount as their actual weight. According to their self-reported weight, the average woman is 13 pounds heavier than in 1990 (from 142 pounds to 155 pounds). At the same time, women's perspective of their ideal weight has increased by nine pounds (from 129 to 138). Since 1990, the average man is 14 pounds heavier today than in 1990, (from 180 pounds to 194 pounds), and their ideal weight has grown by nine pounds (from 171 to 180).
Still, since 1990 there has been a substantial increase -- from 18% to 28% -- in the percentage of Americans saying they are seriously trying to lose weight. Thus, while Americans may be adjusting their weight goals higher as a slim figure gets further and further out of reach, they may actually be more likely today to be trying to reach that goal.

Gender Gaps
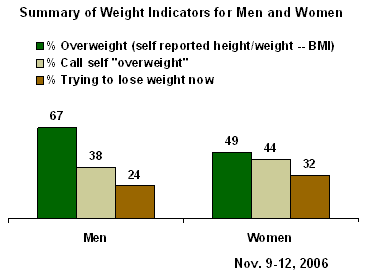
While men and women today are about equally as likely to consider themselves overweight (44% and 38%, respectively), men are substantially more likely than women to be classified as obese or overweight according to their Gallup BMI: 67% of men fall into these categories, compared with 49% of women.
In spite of this, it is women who are most likely to be taking steps to shed some pounds. At present, 32% of women versus 24% of men say they are seriously trying to lose weight.

Survey Methods
Results are based on telephone interviews with 1,004 national adults, aged 18 and older, conducted Nov. 9-12, 2006. For results based on the total sample of national adults, one can say with 95% confidence that the maximum margin of sampling error is ±3 percentage points. In addition to sampling error, question wording and practical difficulties in conducting surveys can introduce error or bias into the findings of public opinion polls.
17. How would you describe your own personal weight situation right now -- very overweight, somewhat overweight, about right, somewhat underweight, or very underweight?
|
Very |
Some- |
About |
Some-what |
Very |
No |
|
|
% |
% |
% |
% |
% |
% |
|
|
2006 Nov 9-12 |
4 |
37 |
53 |
4 |
1 |
* |
|
|
|
|
|
|
|
|
|
2006 Jul 6-9 |
6 |
40 |
49 |
4 |
* |
* |
|
2005 Nov 7-10 |
5 |
37 |
53 |
4 |
1 |
* |
|
2005 Jul 7-10 |
4 |
38 |
52 |
5 |
1 |
* |
|
2004 Nov 7-10 |
5 |
36 |
54 |
5 |
* |
* |
|
2004 Jul 8-11 |
5 |
39 |
50 |
5 |
1 |
* |
|
2003 Nov 3-5 |
4 |
37 |
53 |
5 |
1 |
* |
|
2003 Jul 7-9 |
4 |
39 |
50 |
5 |
1 |
1 |
|
2002 Nov 11-14 |
6 |
36 |
51 |
5 |
1 |
1 |
|
2002 Jul 9-11 |
6 |
34 |
55 |
5 |
* |
* |
|
2001 Nov 8-11 |
6 |
38 |
51 |
4 |
* |
1 |
|
2001 Jul 19-22 |
5 |
41 |
49 |
5 |
* |
* |
|
1999 Jul 22-25 |
4 |
35 |
53 |
6 |
1 |
1 |
|
1990 Oct 18-21 |
7 |
41 |
46 |
5 |
1 |
* |
|
* = Less than 0.5% |
||||||
35. Would you like to [ROTATED: lose weight, stay at your present weight, or put on weight]?
|
Lose |
Put on |
Stay at |
No |
|
|
% |
% |
% |
% |
|
|
National Adults |
|
|
|
|
|
2006 Nov 9-12 |
58 |
5 |
36 |
* |
|
2006 Feb 9-12 |
56 |
4 |
39 |
1 |
|
2005 Nov 7-10 |
60 |
8 |
32 |
* |
|
2004 Nov 7-10 |
62 |
5 |
33 |
* |
|
2003 Nov 3-5 |
60 |
8 |
32 |
* |
|
2002 Nov 11-14 |
58 |
8 |
34 |
* |
|
2001 Jul 19-22 |
59 |
7 |
34 |
* |
|
1999 Jul 22-25 |
52 |
9 |
39 |
* |
|
1996 Feb 23-25 |
55 |
4 |
41 |
* |
|
1990 Oct 18-21 |
52 |
7 |
40 |
1 |
|
1957 Aug 29-Sep 4 |
35 |
11 |
49 |
5 |
|
1955 Jun 24-29 |
37 |
13 |
48 |
2 |
|
1954 Jul 2-7 |
35 |
14 |
50 |
1 |
|
1953 Feb 1-5 |
37 |
13 |
49 |
1 |
|
1951 |
31 |
17 |
50 |
2 |
|
|
|
|
|
|
|
Men |
|
|
|
|
|
2006 Nov 9-12 |
53 |
8 |
39 |
* |
|
2006 Feb 9-12 |
49 |
6 |
43 |
1 |
|
2005 Nov 7-10 |
56 |
9 |
35 |
* |
|
2004 Nov 7-10 |
56 |
6 |
38 |
-- |
|
2003 Nov 3-5 |
51 |
12 |
37 |
* |
|
2002 Nov 11-14 |
49 |
11 |
40 |
* |
|
2001 Jul 19-22 |
49 |
12 |
39 |
-- |
|
1999 Jul 22-25 |
44 |
13 |
43 |
* |
|
1996 Feb 23-25 |
45 |
6 |
49 |
* |
|
1990 Oct 18-21 |
42 |
10 |
47 |
1 |
|
1957 Aug 29-Sep 4 |
25 |
14 |
56 |
5 |
|
1955 Jun 24-29 |
24 |
16 |
58 |
2 |
|
1954 Jul 2-7 |
26 |
16 |
58 |
* |
|
1953 Feb 1-5 |
10 |
20 |
68 |
2 |
|
1951 |
21 |
20 |
57 |
2 |
|
|
|
|
|
|
|
Women |
|
|
|
|
|
2006 Nov 9-12 |
64 |
2 |
34 |
* |
|
2006 Feb 9-12 |
63 |
2 |
35 |
-- |
|
2005 Nov 7-10 |
64 |
6 |
30 |
* |
|
2004 Nov 7-10 |
67 |
4 |
29 |
* |
|
2003 Nov 3-5 |
68 |
4 |
28 |
-- |
|
2002 Nov 11-14 |
66 |
4 |
30 |
* |
|
2001 Jul 19-22 |
68 |
2 |
30 |
* |
|
1999 Jul 22-25 |
58 |
5 |
37 |
* |
|
1996 Feb 23-25 |
63 |
3 |
34 |
* |
|
1990 Oct 18-21 |
61 |
4 |
34 |
1 |
|
1957 Aug 29-Sep 4 |
45 |
8 |
42 |
5 |
|
1955 Jun 24-29 |
49 |
10 |
38 |
3 |
|
1954 Jul 2-7 |
45 |
12 |
42 |
1 |
|
1953 Feb 1-5 |
43 |
11 |
45 |
1 |
|
1951 |
44 |
12 |
43 |
1 |
|
* = Less than 0.5% |
||||
37. At this time are you seriously trying to lose weight?
|
Yes |
No |
No |
|
|
% |
% |
% |
|
|
National Adults |
|
|
|
|
2006 Nov 9-12 |
28 |
71 |
1 |
|
2005 Nov 7-10 |
27 |
73 |
* |
|
2004 Nov 7-10 |
29 |
71 |
* |
|
2003 Nov 3-5 |
28 |
72 |
* |
|
2002 Nov 11-14 |
24 |
75 |
1 |
|
2001 Jul 19-22 |
25 |
75 |
* |
|
1999 Jul 22-25 |
20 |
80 |
* |
|
1996 Feb 23-25 |
26 |
74 |
* |
|
1990 Oct 18-21 |
18 |
82 |
* |
|
1955 |
17 |
83 |
* |
|
1953 |
25 |
75 |
* |
|
1951 |
19 |
81 |
* |
|
|
|
|
|
|
Men |
|
|
|
|
2006 Nov 9-12 |
24 |
75 |
1 |
|
2005 Nov 7-10 |
23 |
77 |
* |
|
2004 Nov 7-10 |
23 |
77 |
-- |
|
2003 Nov 3-5 |
21 |
79 |
* |
|
2002 Nov 11-14 |
19 |
80 |
1 |
|
2001 Jul 19-22 |
17 |
82 |
1 |
|
1999 Jul 22-25 |
16 |
84 |
* |
|
1996 Feb 23-25 |
22 |
78 |
* |
|
1990 Oct 18-21 |
11 |
88 |
1 |
|
|
|
|
|
|
Women |
|
|
|
|
2006 Nov 9-12 |
32 |
67 |
* |
|
2005 Nov 7-10 |
30 |
70 |
* |
|
2004 Nov 7-10 |
34 |
66 |
* |
|
2003 Nov 3-5 |
35 |
65 |
* |
|
2002 Nov 11-14 |
30 |
70 |
* |
|
2001 Jul 19-22 |
32 |
68 |
-- |
|
1999 Jul 22-25 |
24 |
76 |
* |
|
1996 Feb 23-25 |
30 |
70 |
* |
|
1990 Oct 18-21 |
24 |
76 |
* |
|
* = Less than 0.5% |
|||