GALLUP NEWS SERVICE
PRINCETON, NJ -- Gallup's annual Minority Rights and Relations survey, updated in June, detects a downturn in blacks' mood concerning black-white relations in this country. This is seen in blacks' satisfaction with the way blacks are treated in society and in their broad evaluation of white-black relations. At the same time, Gallup finds little change in blacks' more specific evaluations of their own experiences, including satisfaction with their personal lives, in their perceptions of job opportunities for blacks, or in the percentages who report personally being the victim of racism in various situations.
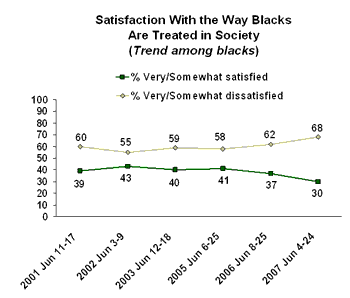
According to the June 4-24, 2007, survey, which includes large samples of blacks and Hispanics, only 30% of blacks in the United States are satisfied with the way blacks are treated in society. A paltry 8% are "very satisfied" while a full two-thirds are now dissatisfied, including 38% who are "very dissatisfied."
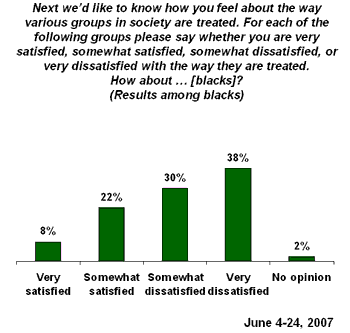
The percentage of blacks saying they are satisfied with the way blacks are treated in U.S. society is down seven points over the last year, from 37% to 30%, and is at the lowest level seen in seven years of tracking this indicator of racial treatment.
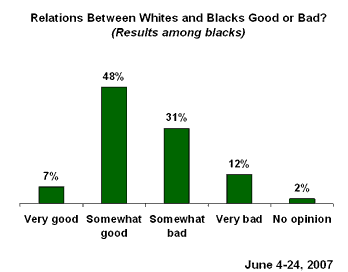
In contrast to this mostly negative assessment, a slight majority of blacks view relations between whites and blacks as either very or somewhat good today, while only 12% are highly negative, calling them "very bad."
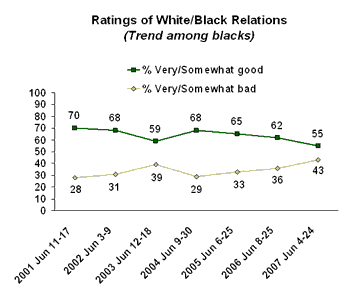
Still, blacks are less positive on this measure than they were a year ago, and are significantly more negative than earlier in the decade, when as many as 70% considered relations "good."
No Increase in Reported Racial Bias
Why these general measures of the climate for blacks in U.S. society have declined is not quite clear, particularly because most of blacks' evaluations of more specific elements of black experiences or their own personal lives have not worsened.
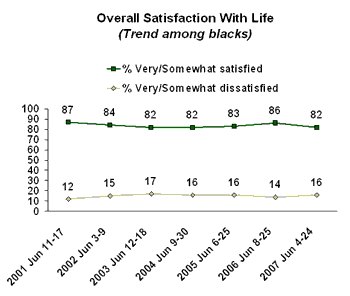
When asked about their personal lives in the broadest terms, most blacks say they are satisfied, and this is virtually unchanged from recent years.
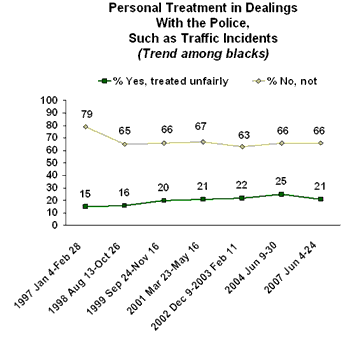
The percentages of blacks saying they have personally felt they were treated unfairly in various situations specifically on account of their race are about the same today as seen when last measured in 2004, and in 2002 before that.
Among all blacks surveyed, the highest level of perceived racial mistreatment is reported with respect to shopping, where 28% of blacks say they felt treated unfairly in the last 30 days. Over the last decade, this figure has ranged from 26% to 30%, so the current level is about average.
About one-quarter of all blacks say they experienced mistreatment at work, also similar to the range since 1997.
Twenty percent of blacks say they experienced mistreatment in a restaurant, bar, theater, or other place of entertainment in the past 30 days -- down from 26% in 2004 -- and roughly the same number (21%) report mistreatment in dealings with the police. While the percentage reporting race-based mistreatment by the police today is similar to 2004, it is slightly higher today than it was in 1997 and 1998.
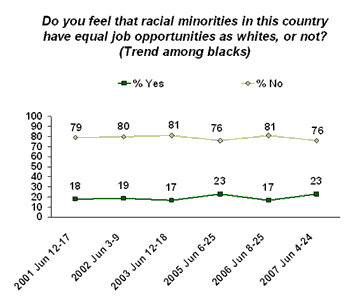
There has also been no significant change in blacks' already quite pessimistic attitudes about equal employment opportunity for minorities. From 2001 through 2006, between 17% and 23% of blacks said that racial minorities do have equal job opportunities with whites, and, at 23%, the current figure is in this range.
No Decline in Racial Attitudes of Whites and Hispanics
The percentage of Americans who are generally satisfied with the nation today is only 24%, compared with 32% a year ago in June. Thus, with public satisfaction with the nation scraping historically low levels today, one explanation for the recent decline in blacks' broad ratings on race relations and treatment of blacks could be this decline in general mood.
If that were the case, one might expect to see similar declines in racial evaluations of society by whites and Hispanics; however, the data do not bear this out. In fact, the racial attitudes of Hispanics have generally not changed much over the past year, while those of whites have grown more positive.
The percentage of Hispanics saying they are satisfied with the way Hispanics are treated in society is currently 37%, similar to the 40% recorded last year.
The percentages of blacks and Hispanics rating black-Hispanic relations as "good" also remained about the same. (A majority of both groups are positive about black-Hispanic relations.)
The percentage of non-Hispanic whites rating white-black relations as good increased from 67% in 2006 to 75% today.
Bottom Line
Blacks' satisfaction with their minority status in society is at the lowest ebb since Gallup began measuring this in 2001. Whether the shifts in attitudes about their treatment in society and white-black relations that led to this represent a meaningful trend or a one-year aberration remains to be seen.
Survey Methods
Results are based on telephone interviews with 2,388 adults nationwide, aged 18 and older, conducted June 4-24, 2007, including oversamples of blacks and Hispanics that are weighted to reflect their proportions in the general population. For results based on the total sample of national adults, one can say with 95% confidence that the maximum margin of sampling error is ±5 percentage points.
For results based on the sample of 868 non-Hispanic whites, the maximum margin of sampling error is ±7 percentage points.
For results based on the sample of 802 blacks, the maximum margin of sampling error is ±6 percentage points.
For results based on the sample of 502 Hispanics, the maximum margin of sampling error is ±6 percentage points (138 out of the 502 interviews with Hispanics were conducted in Spanish).
In addition to sampling error, question wording and practical difficulties in conducting surveys can introduce error or bias into the findings of public opinion polls.
5. Next we'd like to know how you feel about the way various groups in society are treated. For each of the following groups please say whether you are very satisfied, somewhat satisfied, somewhat dissatisfied, or very dissatisfied with the way they are treated. How about… [RANDOM ORDER]?
|
2007 Jun 4-24
|
|
Non-
|
|
|
|
% |
% |
% |
% |
|
|
Asians |
72 |
77 |
59 |
58 |
|
Women |
69 |
73 |
45 |
60 |
|
Blacks |
63 |
71 |
30 |
46 |
|
Hispanics |
56 |
63 |
39 |
37 |
|
Arabs |
52 |
57 |
36 |
38 |
|
Immigrants |
43 |
48 |
32 |
25 |
Full satisfaction trend
C. Blacks
|
|
Very
|
Some-
|
Some-
|
Very dis-
|
No
|
Total
|
Total
|
|
Total |
% |
% |
% |
% |
% |
% |
% |
|
2007 Jun 4-24 |
21 |
42 |
20 |
13 |
4 |
63 |
33 |
|
2006 Jun 8-25 |
17 |
44 |
24 |
12 |
3 |
61 |
36 |
|
2005 Jun 6-25 |
16 |
43 |
23 |
14 |
4 |
59 |
37 |
|
2003 Jun 12-18 |
20 |
44 |
22 |
12 |
2 |
64 |
34 |
|
2002 Jun 3-9 |
19 |
45 |
22 |
11 |
3 |
64 |
33 |
|
2001 Jun 11-17 |
20 |
41 |
24 |
13 |
2 |
61 |
37 |
|
|
|
|
|
|
|
|
|
|
Non-Hispanic Whites |
|
|
|
|
|
|
|
|
2007 Jun 4-24 |
22 |
49 |
15 |
9 |
4 |
71 |
24 |
|
2006 Jun 8-25 |
17 |
49 |
24 |
7 |
3 |
66 |
31 |
|
2005 Jun 6-25 |
18 |
48 |
21 |
10 |
3 |
66 |
31 |
|
2003 Jun 12-15 |
22 |
46 |
22 |
8 |
2 |
68 |
30 |
|
2002 Jun 3-6 |
19 |
49 |
21 |
8 |
3 |
68 |
29 |
|
2001 Jun 11-17 |
20 |
44 |
25 |
9 |
2 |
64 |
34 |
|
|
|
|
|
|
|
|
|
|
Blacks |
|
|
|
|
|
|
|
|
2007 Jun 4-24 |
8 |
22 |
30 |
38 |
2 |
30 |
68 |
|
2006 Jun 8-25 |
7 |
30 |
29 |
33 |
1 |
37 |
62 |
|
2005 Jun 6-25 |
8 |
33 |
28 |
30 |
1 |
41 |
58 |
|
2003 Jun 12-18 |
10 |
30 |
20 |
39 |
1 |
40 |
59 |
|
2002 Jun 3-9 |
12 |
31 |
26 |
29 |
2 |
43 |
55 |
|
2001 Jun 11-17 |
8 |
31 |
28 |
32 |
1 |
39 |
60 |
|
|
|
|
|
|
|
|
|
|
Hispanics |
|
|
|
|
|
|
|
|
2007 Jun 4-24 |
17 |
29 |
31 |
16 |
6 |
46 |
47 |
|
2006 Jun 8-25 |
23 |
23 |
27 |
20 |
7 |
46 |
47 |
|
2005 Jun 6-25 |
15 |
30 |
27 |
19 |
9 |
45 |
46 |
|
2003 Jun 12-18 |
11 |
47 |
22 |
16 |
4 |
58 |
38 |
|
2002 Jun 3-9 |
19 |
38 |
24 |
14 |
5 |
57 |
38 |
|
2001 Jun 11-17 |
15 |
35 |
26 |
18 |
6 |
50 |
44 |
6. Next, we'd like to know how you would rate relations between various groups in the United States these days. Would you say relations between -- [RANDOM ORDER] -- are very good, somewhat good, somewhat bad, or very bad?
|
2007 Jun 4-24
|
|
Non-
|
|
|
|
% |
% |
% |
% |
|
|
Whites and Asians |
80 |
83 |
69 |
72 |
|
Whites and blacks |
71 |
75 |
55 |
59 |
|
Whites and Hispanics |
66 |
68 |
53 |
70 |
|
Blacks and Hispanics |
49 |
46 |
68 |
59 |
Full trend: relations between groups
A. Whites and blacks
|
|
Very
|
Some-
|
Some-
|
Very
|
No
|
Total
|
Total
|
|
Total |
% |
% |
% |
% |
% |
% |
% |
|
2007 Jun 4-24 |
10 |
61 |
24 |
4 |
1 |
71 |
28 |
|
2006 Jun 8-25 |
9 |
55 |
25 |
9 |
2 |
64 |
34 |
|
2005 Jun 6-25 |
11 |
57 |
23 |
6 |
3 |
68 |
29 |
|
2004 Jun 9-30 |
13 |
59 |
20 |
6 |
2 |
72 |
26 |
|
2003 Jun 12-18 |
10 |
58 |
24 |
6 |
2 |
68 |
30 |
|
2002 Jun 3-9 |
8 |
61 |
23 |
5 |
3 |
69 |
28 |
|
2001 Jun 11-17 |
6 |
57 |
28 |
7 |
2 |
63 |
35 |
|
|
|
|
|
|
|
|
|
|
Non-Hispanic Whites |
|
|
|
|
|
|
|
|
2007 Jun 4-24 |
11 |
64 |
23 |
2 |
* |
75 |
25 |
|
2006 Jun 8-25 |
10 |
57 |
26 |
6 |
2 |
67 |
32 |
|
2005 Jun 6-25 |
11 |
61 |
22 |
5 |
1 |
72 |
27 |
|
2004 Jun 9-30 |
13 |
61 |
20 |
5 |
1 |
74 |
25 |
|
2003 Jun 12-15 |
10 |
59 |
25 |
5 |
1 |
69 |
30 |
|
2002 Jun 3-6 |
7 |
63 |
24 |
3 |
3 |
70 |
27 |
|
2001 Jun 11-17 |
6 |
56 |
30 |
6 |
2 |
62 |
36 |
|
|
|
|
|
|
|
|
|
|
Blacks |
|
|
|
|
|
|
|
|
2007 Jun 4-24 |
7 |
48 |
31 |
12 |
2 |
55 |
43 |
|
2006 Jun 8-25 |
7 |
55 |
22 |
14 |
2 |
62 |
36 |
|
2005 Jun 6-25 |
10 |
55 |
20 |
13 |
2 |
65 |
33 |
|
2004 Jun 9-30 |
12 |
56 |
21 |
8 |
3 |
68 |
29 |
|
2003 Jun 12-18 |
9 |
50 |
26 |
13 |
2 |
59 |
39 |
|
2002 Jun 3-9 |
9 |
59 |
18 |
13 |
1 |
68 |
31 |
|
2001 Jun 11-17 |
8 |
62 |
17 |
11 |
2 |
70 |
28 |
|
|
|
|
|
|
|
|
|
|
Hispanics |
|
|
|
|
|
|
|
|
2007 Jun 4-24 |
9 |
50 |
25 |
10 |
6 |
59 |
35 |
|
2006 Jun 8-25 |
10 |
48 |
24 |
14 |
5 |
58 |
38 |
|
2005 Jun 6-25 |
11 |
47 |
27 |
11 |
4 |
58 |
38 |
|
2004 Jun 9-30 |
12 |
49 |
21 |
10 |
8 |
61 |
31 |
|
2003 Jun 12-18 |
11 |
57 |
19 |
9 |
4 |
68 |
28 |
|
2002 Jun 3-9 |
9 |
53 |
25 |
9 |
4 |
62 |
34 |
|
2001 Jun 11-17 |
8 |
57 |
18 |
14 |
3 |
65 |
32 |
|
* Less than 0.5% |
|||||||
12. Can you think of any occasion in the last thirty days when you felt you were treated unfairly in the following places because you were black? How about -- [RANDOM ORDER]?
|
2007 Jun 4-24
|
Yes,
|
No,
|
|
% |
% |
|
|
In a store where you were shopping |
28 |
69 |
|
At your place of work |
23 |
62 |
|
In dealings with the police, such as traffic incidents |
21 |
66 |
|
In a restaurant, bar, theater, or other entertainment place |
20 |
76 |
Full results and trends
A. At your place of work
|
|
Yes,
|
No, not
|
Not
|
|
Blacks |
% |
% |
% |
|
2007 Jun 4-24 |
23 |
62 |
15 |
|
2004 Jun 9-30 |
22 |
61 |
17 |
|
2002 Dec 9-2003 Feb 11 |
23 |
54 |
23 |
|
2001 Mar 23-May 16 |
19 |
65 |
16 |
|
1999 Sep 24-Nov 16 |
19 |
63 |
18 |
|
1998 Aug 13-Oct 26 |
18 |
63 |
19 |
|
1997 Jan 4-Feb 28 |
21 |
77 |
2 |
B. In a store where you were shopping
|
|
Yes,
|
No, not
|
Not
|
|
Blacks |
% |
% |
% |
|
2007 Jun 4-24 |
28 |
69 |
3 |
|
2004 Jun 9-30 |
28 |
71 |
1 |
|
2002 Dec 9-2003 Feb 11 |
28 |
70 |
2 |
|
2001 Mar 23-May 16 |
27 |
71 |
2 |
|
1999 Sep 24-Nov 16 |
27 |
70 |
3 |
|
1998 Aug 13-Oct 26 |
26 |
72 |
2 |
|
1997 Jan 4-Feb 28 |
30 |
70 |
-- |
D. In a restaurant, bar, theater, or other entertainment place
|
|
Yes,
|
No, not
|
Not
|
|
Blacks |
% |
% |
% |
|
2007 Jun 4-24 |
20 |
76 |
4 |
|
2004 Jun 9-30 |
26 |
69 |
5 |
|
2002 Dec 9-2003 Feb 11 |
24 |
69 |
7 |
|
2001 Mar 23-May 16 |
20 |
75 |
5 |
|
1999 Sep 24-Nov 16 |
19 |
75 |
6 |
|
1998 Aug 13-Oct 26 |
16 |
76 |
8 |
|
1997 Jan 4-Feb 28 |
21 |
76 |
3 |
E. In dealings with the police, such as traffic incidents
|
|
Yes,
|
No, not
|
Not
|
|
Blacks |
% |
% |
% |
|
2007 Jun 4-24 |
21 |
66 |
13 |
|
2004 Jun 9-30 |
25 |
66 |
9 |
|
2002 Dec 9-2003 Feb 11 |
22 |
63 |
15 |
|
2001 Mar 23-May 16 |
21 |
67 |
12 |
|
1999 Sep 24-Nov 16 |
20 |
66 |
14 |
|
1998 Aug 13-Oct 26 |
16 |
65 |
19 |
|
1997 Jan 4-Feb 28 |
15 |
79 |
6 |
