GALLUP NEWS SERVICE
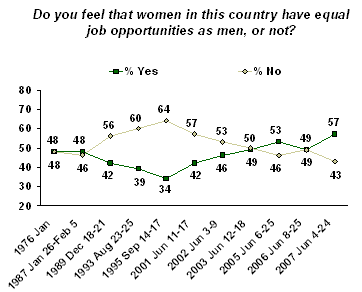
PRINCETON, NJ -- Americans' belief that women have equal job opportunities as men in the United States has expanded to the point that a solid majority now believe such parity exists.
According to Gallup's annual Minority Rights and Relations survey, updated June 4-24, 2007, 57% of Americans believe women in this country have equal job opportunities as men. This is up from 49% in June 2006 (and 53% in 2005), and is the highest positive evaluation given on this measure across the 11 times it has been asked since 1976.
A Hillary Effect?
There are some signs in the inner workings of Gallup's trends on the issue to suggest one reason for this positive change could be the career success and high visibility of Hillary Clinton. With the reality growing over the past year that Clinton is the first female candidate with a real prospect of winning the U.S. presidency, Democrats -- and Democratic women, in particular -- may be encouraged about women's workplace rights more broadly. The ascension of Nancy Pelosi as the first female Speaker of the U.S. House of Representatives could also be a factor.
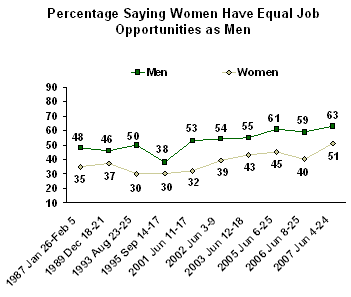
Men's views on this question have not changed significantly over the past year. The 63% of men currently saying women have equal job opportunities is within the margin of sampling error of the 59% recorded last year. Women's 11-point increase in positive evaluations, from 40% in 2006 to 51% today, is significant.
However, a closer look at the data indicates that the division in attitudes is not so much men versus women, but Republican versus Democrat.
Surge in Democratic Women's Perceptions of Women's Job Rights
The percentage of all Democrats (including independents who lean Democratic) saying women have equal job rights grew from 34% to 51% over the past year, while among Republicans (including Republican leaners) it declined slightly from 70% to 62%.
The large sample sizes collected for this survey afford a sufficient number of cases to look more closely at the trend by examining the views of men and women by party. According to the 2006-2007 figures, Republican women and Republican men have become less confident about women's job opportunities, while Democratic women and Democratic men have grown more confident. This increase is most pronounced with Democratic women, where a 20-percentage point increase is seen in the percentage saying women have equal job opportunities.
The net result of these changes is that men and women of both parties now share fairly similar views about the job rights of women -- whereas a year ago, Republican men and women were much more positive about the issue than Democrats of either sex.
|
Percentage Saying Women Have Equal
|
||||
|
Republican
|
Democratic
|
Republican
|
Democratic
|
|
|
% |
% |
% |
% |
|
|
2006 |
63 |
27 |
76 |
43 |
|
2007 |
55 |
47 |
69 |
56 |
|
Change |
-8 |
+20 |
-7 |
+13 |
Views of Opportunities for Racial Minorities
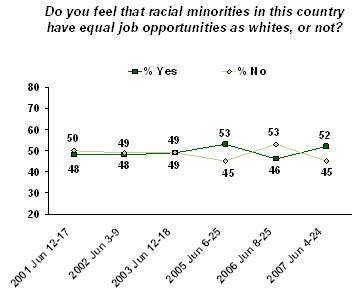
It's possible that this year's more-positive review of women's job opportunities is part of a broader improvement in the public's mood about minority rights, rather than a reaction to Clinton or some other cultural phenomenon specific to women. However, a similar increase in positive views is not seen with respect to perceptions of job opportunities for racial minorities.
The percentage of Americans responding positively about racial minorities' job opportunities is only slightly higher in the 2007 Minority Rights and Relations survey than it was in 2006, and is not much different from the typical positive response recorded over the last several years.
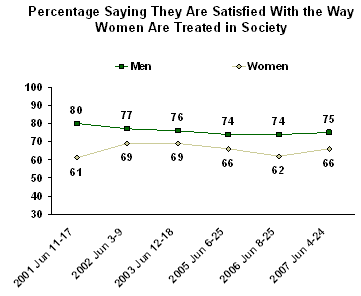
Additionally, there has been essentially no change in public perceptions of society's general treatment of women. The percentage of all Americans who say they are satisfied with the way women are treated in society is 69% today, compared with 67% last year. The views of men and women have been fairly stable on this issue over the past year as well.
Bottom Line
There has been a clear increase in the past year of public perceptions that women have equal job opportunities as men. This is entirely due to an improved outlook among Democrats -- and in particular among female Democrats. It's an intriguing finding -- and one that could be at least partially explained by the historic significance of Clinton's and Pelosi's current positions in the Democratic Party.
Survey Methods
Results are based on telephone interviews with 2,388 adults nationwide, aged 18 and older, conducted June 4-24, 2007, including oversamples of blacks and Hispanics that are weighted to reflect their proportions in the general population. For results based on the total sample of national adults, one can say with 95% confidence that the maximum margin of sampling error is ±5 percentage points.
For results based on sample of 987 men, the maximum margin of sampling error is ±8 percentage points.
For results based on sample of 1,401 women, the maximum margin of sampling error is ±7 percentage points.
In addition to sampling error, question wording and practical difficulties in conducting surveys can introduce error or bias into the findings of public opinion polls.
5. Next we'd like to know how you feel about the way various groups in society are treated. For each of the following groups please say whether you are very satisfied, somewhat satisfied, somewhat dissatisfied, or very dissatisfied with the way they are treated. How about… [RANDOM ORDER]?
|
2007 Jun 4-24
|
|
Non-Hispanic Whites |
|
|
|
% |
% |
% |
% |
|
|
Asians |
72 |
77 |
59 |
58 |
|
Women |
69 |
73 |
45 |
60 |
|
Blacks |
63 |
71 |
30 |
46 |
|
Hispanics |
56 |
63 |
39 |
37 |
|
Arabs |
52 |
57 |
36 |
38 |
|
Immigrants |
43 |
48 |
32 |
25 |
B. Women
|
Very
|
Some-
|
Some-
|
Very
|
No
|
Total
|
Total
|
|
|
% |
% |
% |
% |
% |
% |
% |
|
|
Total |
|
|
|
|
|
|
|
|
2007 Jun 4-24 |
26 |
43 |
17 |
11 |
3 |
69 |
28 |
|
2006 Jun 8-25 |
25 |
42 |
20 |
11 |
1 |
67 |
31 |
|
2005 Jun 6-25 |
24 |
46 |
20 |
9 |
1 |
70 |
29 |
|
2003 Jun 12-18 |
28 |
44 |
17 |
10 |
1 |
72 |
27 |
|
2002 Jun 3-9 |
25 |
47 |
17 |
9 |
2 |
72 |
26 |
|
2001 Jun 11-17 |
24 |
46 |
18 |
11 |
1 |
70 |
29 |
|
|
|
|
|
|
|
|
|
|
Men |
|
|
|
|
|
|
|
|
2007 Jun 4-24 |
33 |
42 |
13 |
9 |
4 |
75 |
22 |
|
2006 Jun 8-25 |
35 |
39 |
19 |
7 |
1 |
74 |
26 |
|
2005 Jun 6-25 |
28 |
46 |
17 |
7 |
2 |
74 |
24 |
|
2003 Jun 12-18 |
36 |
40 |
17 |
6 |
1 |
76 |
23 |
|
2002 Jun 3-9 |
34 |
43 |
15 |
6 |
2 |
77 |
21 |
|
2001 Jun 11-17 |
35 |
45 |
13 |
6 |
1 |
80 |
19 |
|
|
|
|
|
|
|
|
|
|
Women |
|
|
|
|
|
|
|
|
2007 Jun 4-24 |
21 |
45 |
20 |
13 |
2 |
66 |
33 |
|
2006 Jun 8-25 |
17 |
45 |
22 |
15 |
1 |
62 |
37 |
|
2005 Jun 6-25 |
19 |
47 |
23 |
10 |
1 |
66 |
33 |
|
2003 Jun 12-18 |
21 |
48 |
16 |
14 |
1 |
69 |
30 |
|
2002 Jun 3-9 |
18 |
51 |
19 |
11 |
1 |
69 |
30 |
|
2001 Jun 11-17 |
13 |
48 |
22 |
15 |
2 |
61 |
37 |
21. Do you feel that women in this country have equal job opportunities as men, or not?
|
Yes |
No |
No
|
|
|
% |
% |
% |
|
|
Total |
|
|
|
|
2007 Jun 4-24 |
57 |
43 |
* |
|
2006 Jun 8-25 |
49 |
49 |
2 |
|
2005 Jun 6-25 |
53 |
46 |
1 |
|
2003 Jun 12-18 |
49 |
50 |
1 |
|
2002 Jun 3-9 |
46 |
53 |
1 |
|
2001 Jun 11-17 |
42 |
57 |
1 |
|
1995 Sep 14-17 |
34 |
64 |
2 |
|
1993 Aug 23-25 |
39 |
60 |
1 |
|
1989 Dec 18-21 |
42 |
56 |
2 |
|
1987 Jan 26-Feb 5 |
48 |
46 |
6 |
|
1976 Jan |
48 |
48 |
4 |
|
|
|
|
|
|
Men |
|
|
|
|
2007 Jun 4-24 |
63 |
36 |
* |
|
2006 Jun 8-25 |
59 |
39 |
2 |
|
2005 Jun 6-25 |
61 |
37 |
2 |
|
2003 Jun 12-18 |
55 |
44 |
1 |
|
2002 Jun 3-9 |
54 |
45 |
1 |
|
2001 Jun 11-17 |
53 |
46 |
1 |
|
1995 Sep 14-17 |
38 |
59 |
3 |
|
1993 Aug 23-25 |
50 |
50 |
* |
|
1989 Dec 18-21 |
46 |
52 |
2 |
|
1987 Jan 26-Feb 5 |
48 |
46 |
6 |
|
|
|
|
|
|
Women |
|
|
|
|
2007 Jun 4-24 |
51 |
49 |
* |
|
2006 Jun 8-25 |
40 |
58 |
2 |
|
2005 Jun 6-25 |
45 |
55 |
* |
|
2003 Jun 12-18 |
43 |
56 |
1 |
|
2002 Jun 3-9 |
39 |
60 |
1 |
|
2001 Jun 11-17 |
32 |
67 |
1 |
|
1995 Sep 14-17 |
30 |
69 |
3 |
|
1993 Aug 23-25 |
30 |
69 |
1 |
|
1989 Dec 18-21 |
37 |
60 |
3 |
|
1987 Jan 26-Feb 5 |
35 |
56 |
9 |
|
|
|
|
|
|
* = Less than 0.5% |
|||