GALLUP NEWS SERVICE
PRINCETON, NJ -- Gallup's recent Minority Rights and Relations survey updated a long-term trend that asks Americans if they "approve or disapprove of marriages between blacks and whites."
More than three in four Americans say they approve of marriages between blacks and whites -- similar to the results measured in 2003 and 2004. As recently as 1994, less than half of Americans approved. The vast majority of whites and an even larger majority of blacks approve of interracial marriages. Older Americans -- regardless of race or ethnicity -- are less inclined to support interracial marriages than are younger Americans, but still, older Americans show majority support.
The poll was conducted June 4-24, 2007, interviewing 2,388 adults nationwide, including 1,302 whites, 802 non-Hispanic blacks, and 502 Hispanics. The total sample is weighted to reflect the proper proportions of each group in the U.S. population. About one-quarter of the interviews with Hispanics were conducted in Spanish, with the remainder in English.
Overall Results
According to the poll, 77% of Americans say they approve of marriages between blacks and whites, while 17% say they disapprove. Public support for black-white marriages is now at the high end of the range of approval seen on this question since Gallup first asked it almost 50 years ago. The latest result essentially ties with the 76% approval rating found in 2004.
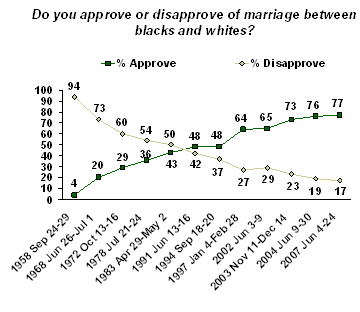
Gallup's long-term trend on this question documents a sea change in public attitudes about interracial marriage. In 1958, only 4% of Americans said they approved of marriages between whites and blacks. (The precise wording of the Gallup question has changed across the decades as the commonly accepted descriptive terms for blacks have changed; when Gallup first asked the question in 1958, the poll wording was, "whites and non-whites.") Approval gradually increased over the next few decades, but at least half of Americans disapproved of black-white unions through 1983. Then, in the next measure eight years later, disapproval had fallen to 42%, with 48% approving. In 1997, the next time Gallup asked the question, approval had jumped well into the majority, with nearly two in three Americans saying they approved of marriages between blacks and whites. Disapproval fell to 27% in that same year. Support remained at about the two-thirds level until 2002, but increased to 73% in 2003. Since then, there have only been modest variations in attitudes about interracial marriages.
Black-White Marriage Support by Racial and Ethnic Groups
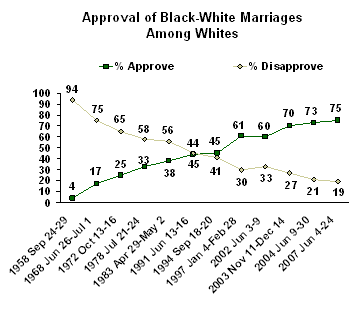
Seventy-five percent of whites approve of marriages between blacks and whites, and 19% disapprove. The trends in whites' approval of interracial marriages closely mirror that of the general population. Few whites approved of interracial marriage in 1958, but support gradually increased, reaching majority level in 1997 and then edging up to the current 75% approval rating, the highest point to date, though by a statistically insignificant two points compared with Gallup's 2004 survey.
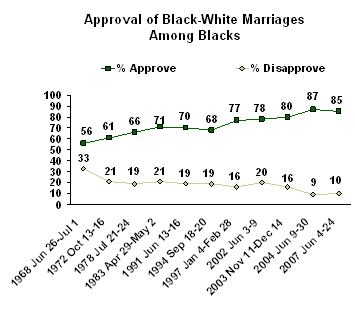
Blacks are even more likely than whites to approve of interracial marriages -- 85% of blacks currently say they approve, leaving 10% of blacks who disapprove and 5% who do not express an opinion.
The attitudes of blacks about interracial marriage are not available from Gallup's initial 1958 polling on the subject. However, starting with the 1968 poll, a majority of blacks have consistently approved of marriages between blacks and whites. In the 1968 poll, 56% of blacks said they approved of black-white unions. This percentage gradually increased by the late 1970s to the mid-60% range and then to the low 70% range in the 1980s and early 1990s. By 1997, three in four blacks approved of interracial marriages, and since 2003, at least 80% have approved.
Hispanics' opinions about black-white marriages are similar to blacks, with 87% of Hispanics in the June 2007 update approving and 10% disapproving. These results have not shown much significant change since Gallup first asked this question of Hispanics in 2002.
Younger vs. Older Americans' Attitudes Toward Interracial Marriage
Americans aged 50 and older -- including whites, blacks, and Hispanics in this age group -- are less likely to approve of these unions than those 18 to 49 years of age. However, a majority of older Americans in each racial group still say they approve of black-white marriages.
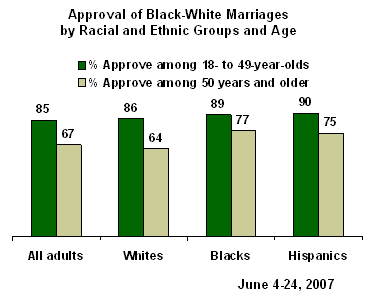
Overall, 85% of Americans between the ages of 18 and 49 approve of marriages between blacks and whites, while among those aged 50 and older, 67% approve. These results are similar among whites -- 86% of whites ages 18 to 49 approve, compared with 64% of whites who are older.
At each age level, blacks' show greater approval of interracial marriage compared with whites. Still, older blacks show less support for black-white unions than younger blacks do. Among blacks ages 18 to 49, 89% approve of interracial marriage, while among blacks aged 50 and older, 77% approve. Approval of interracial marriage among Hispanics by age is similar to that of blacks.
Survey Methods
Results are based on telephone interviews with 2,388 national adults, aged 18 and older, conducted June 4-24, 2007, including oversamples of Blacks and Hispanics that are weighted to reflect their proportions in the general population. For results based on the total sample of national adults, one can say with 95% confidence that the maximum margin of sampling error is ±5 percentage points.
For results based on sample of 1,302 whites (including 434 white Hispanics), the maximum margin of sampling error is ±7 percentage points.
For results based on sample of 802 blacks, the maximum margin of sampling error is ±6 percentage points.
For results based on sample of 502 Hispanics, the maximum margin of sampling error is ±6 percentage points. (138 out of the 502 interviews with Hispanics were conducted in Spanish).
In addition to sampling error, question wording and practical difficulties in conducting surveys can introduce error or bias into the findings of public opinion polls.
|
Do you approve or disapprove of marriage between blacks and whites? |
|||
|
Approve |
Disapprove |
No |
|
|
Total |
% |
% |
% |
|
2007 Jun 4-24 |
77 |
17 |
6 |
|
2004 Jun 9-30 |
76 |
19 |
5 |
|
2003 Nov 11-Dec 14 |
73 |
23 |
4 |
|
2002 Jun 3-9 |
65 |
29 |
6 |
|
1997 Jan 4-Feb 28 |
64 |
27 |
9 |
|
1994 Sep 18-20 |
48 |
37 |
15 |
|
1991 Jun 13-16 |
48 |
42 |
10 |
|
1983 Apr 29-May 2 |
43 |
50 |
7 |
|
1978 Jul 21-24^ |
36 |
54 |
10 |
|
1972 Oct 13-16^ |
29 |
60 |
11 |
|
1968 Jun 26-Jul 1 ^ |
20 |
73 |
8 |
|
1958 Sep 24-29† |
4 |
94 |
3 |
|
|
|
|
|
|
Non-Hispanic Whites |
|
|
|
|
2007 Jun 4-24 |
75 |
20 |
6 |
|
2004 Jun 9-30 |
72 |
23 |
5 |
|
|
|
|
|
|
Long-term trend: Whites (including Hispanics) |
|||
|
2007 Jun 4-24 |
75 |
19 |
5 |
|
2004 Jun 9-30 |
73 |
21 |
6 |
|
2003 Nov 11-Dec 14 |
70 |
27 |
3 |
|
2002 Jun 3-6 |
60 |
33 |
7 |
|
1997 Jan 4-Feb 28 |
61 |
30 |
9 |
|
1994 Sep 18-20 |
45 |
41 |
14 |
|
1991 Jun 13-16 |
44 |
45 |
11 |
|
1983 Apr 29-May 2 |
38 |
56 |
6 |
|
1978 Jul 21-24^ |
33 |
58 |
9 |
|
1972 Oct 13-16^ |
25 |
65 |
10 |
|
1968 Jun 26-Jul 1 ^ |
17 |
75 |
7 |
|
1958 Sep 24-29† |
4 |
94 |
3 |
|
|
|
|
|
|
Blacks |
|
|
|
|
2007 Jun 4-24 |
85 |
10 |
4 |
|
2004 Jun 9-30 |
87 |
9 |
4 |
|
2003 Nov 11-Dec 14 |
80 |
16 |
4 |
|
2002 Jun 3-9 |
78 |
20 |
2 |
|
1997 Jan 4-Feb 28 |
77 |
16 |
7 |
|
1994 Sep 18-20 |
68 |
19 |
13 |
|
1991 Jun 13-16 |
70 |
19 |
11 |
|
1983 Apr 29-May 2 |
71 |
21 |
9 |
|
1978 Jul 21-24^ |
66 |
19 |
15 |
|
1972 Oct 13-16^ |
61 |
21 |
19 |
|
1968 Jun 26-Jul 1 ^ |
56 |
33 |
11 |
|
|
|
|
|
|
Hispanics |
|
|
|
|
2007 Jun 4-24 |
87 |
10 |
3 |
|
2004 Jun 9-30 |
88 |
7 |
5 |
|
2003 Nov 11-Dec 14 |
77 |
15 |
8 |
|
2002 Jun 3-9 |
84 |
10 |
6 |
|
^ WORDING: Between whites and non-whites? |
|||
