GALLUP NEWS SERVICE
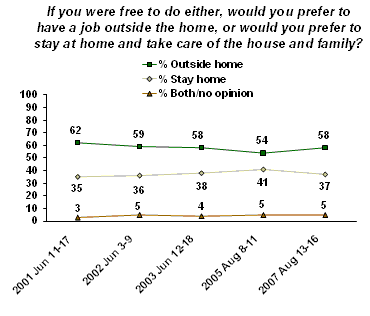
PRINCETON, NJ -- Even if they were "free to do either," most Americans say they would prefer to work outside the home rather than stay at home to take care of their house and family. The allure of holding down the domestic fort is stronger for women than men; but, in a switch from recent years, a slight plurality of women now share men's preference for an outside job. This is according to Gallup's annual Work and Education survey, updated Aug. 13-16, 2007.
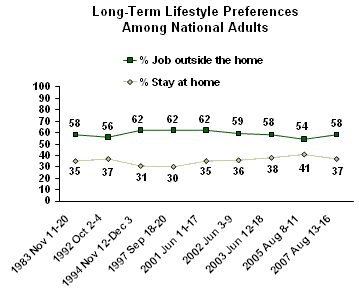
Overall, 58% of Americans -- both men and women -- say they would prefer to have a job outside the home; 37% would rather do what is often considered traditional homemaking. While these responses have varied a bit in recent years, the current figures are not much different from Gallup's first measurement in 2001. They are also identical to the average responses Gallup has recorded across this period.
Women Switch Gears
This stability in the overall numbers masks some slight, but notable, changes among and men and women during the past six years.
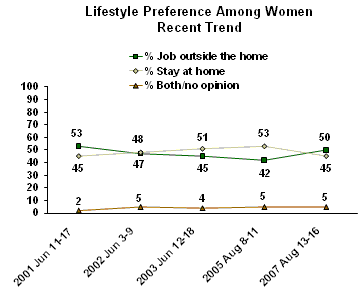
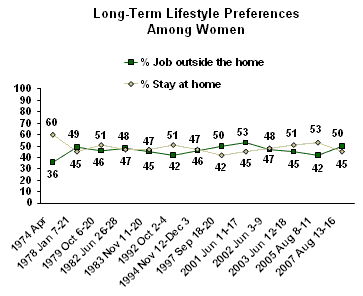
Between 2001 and 2005, Gallup recorded a decline in the percentage of women preferring to work outside the home, dropping from 53% to 42%. This year, however, 50% of women say they would rather hold a job outside the home, representing a near reversal of attitudes. As in 2001, more women now say they would rather work outside the home than stay at home (50% vs. 45%).
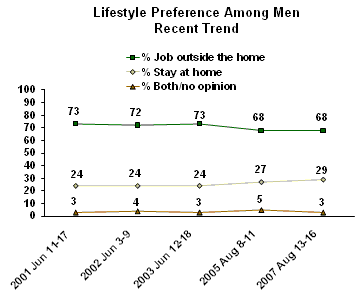
Over the same period, the percentage of men preferring an outside job has dipped slightly, falling from 73% in 2001 to 68% in 2005, where it remains today. Nearly one in three men, up from one in four in 2001, now say they would prefer to stay at home.
Employed Americans and Retirees Have Similar Lifestyle Preferences
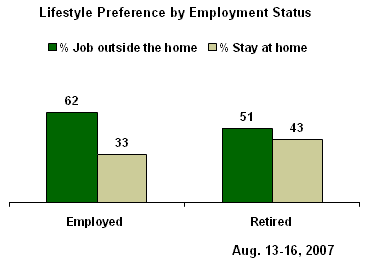
The percentage of working Americans choosing an outside job over staying at home is not much greater than the national average. Sixty-two percent of Americans who are currently employed full time or part time opt for having a job. This is also similar to the percentage of retired Americans choosing the same (51%).
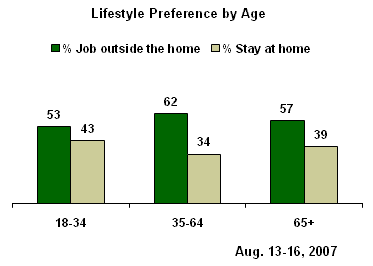
Along the same lines, different age groups are fairly similar in their preferences. The majority of those in each of three major age groups, including those 65 and older, say they would prefer work to homemaking.
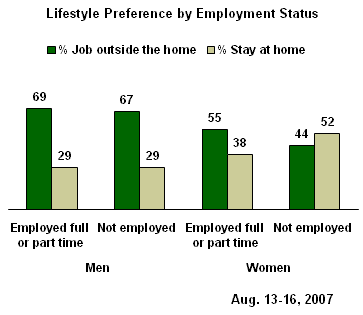
The gender gap in preferences for working versus staying at home among all men (68%) and women (50%) is a bit smaller when looking just at men and women who are employed. Among full and part time workers, 69% of men versus 55% of women say that, if they were free to do either, they would rather work -- a 14-point difference. By contrast, among adults who don't currently work (including retirees, homemakers, students, and the unemployed), the gender gap is 23 points (67% of non-working men vs. 44% of non-working women would opt to work instead of staying home).
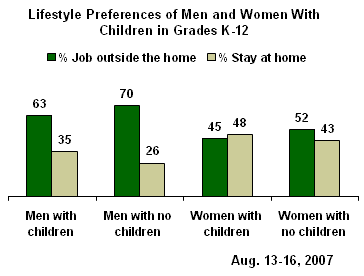
Men and women with children in grades K-12 are only slightly more likely than their counterparts without school-age children to prefer staying at home, and not by significant margins.
Homemaking is Too Difficult?
With most singles needing to provide for themselves and most couples now relying on two incomes, there are few Americans who can afford not to work. Yet even when given a hypothetical free choice between working and staying at home to take care of the hearth and family, most Americans, even those who are retired, say they would rather work. Thus, it appears people value work for more than the income it provides; or, perhaps, they are daunted by the demands of raising a family.
The public's preference for outside work over homemaking is not a new phenomenon. Previous readings on this question by other polling organizations show fairly steady responses since at least 1983.
Some earlier polls surveyed only women, and show attitudes very similar to current poll findings as far back as the late 1970s. Between 1978 and now, women have been closely divided in their preference between the two options. One needs to go back to the earliest survey from 1974 to find a substantial majority of women (60%) saying they would prefer taking care of their house and family to holding down a job outside the home.
Survey Methods
Results are based on telephone interviews with 1,019 national adults, aged 18 and older, conducted Aug. 13-16, 2007. For results based on the total sample of national adults, one can say with 95% confidence that the maximum margin of sampling error is ±3 percentage points.
In addition to sampling error, question wording and practical difficulties in conducting surveys can introduce error or bias into the findings of public opinion polls.
34. If you were free to do either, would you prefer to have a job outside the home, or would you prefer to stay at home and take care of the house and family?
|
|
Outside
|
Stay
|
BOTH
|
No
|
|
National Adults |
% |
% |
% |
% |
|
2007 Aug 13-16 |
58 |
37 |
3 |
2 |
|
2005 Aug 8-11 |
54 |
41 |
4 |
1 |
|
2003 Jun 12-18 |
58 |
38 |
3 |
1 |
|
2002 Jun 3-9 |
59 |
36 |
4 |
1 |
|
2001 Jun 11-17 |
62 |
35 |
2 |
1 |
|
1997 Sep 18-20 ^ |
62 |
30 |
5 |
3 |
|
1994 Nov 12-Dec 3 ‡ |
62 |
31 |
-- |
7 |
|
1992 Oct 2-4 ? |
56 |
37 |
5 |
2 |
|
1983 Nov 11-20 ? |
58 |
35 |
3 |
4 |
|
|
|
|
|
|
|
Men |
|
|
|
|
|
2007 Aug 13-16 |
68 |
29 |
1 |
2 |
|
2005 Aug 8-11 |
68 |
27 |
3 |
2 |
|
2003 Jun 12-18 |
73 |
24 |
3 |
* |
|
2002 Jun 3-9 |
72 |
24 |
3 |
1 |
|
2001 Jun 11-17 |
73 |
24 |
2 |
1 |
|
1997 Sep 18-20 ^ |
74 |
17 |
5 |
4 |
|
1994 Nov 12-Dec 3 ‡ |
78 |
15 |
-- |
7 |
|
1992 Oct 2-4 ^ |
72 |
21 |
5 |
2 |
|
1983 Nov 11-20 ? |
72 |
21 |
1 |
6 |
|
|
|
|
|
|
|
Women |
|
|
|
|
|
2007 Aug 13-16 |
50 |
45 |
4 |
1 |
|
2005 Aug 8-11 |
42 |
53 |
4 |
1 |
|
2003 Jun 12-18 |
45 |
51 |
3 |
1 |
|
2002 Jun 3-9 |
47 |
48 |
4 |
1 |
|
2001 Jun 11-17 |
53 |
45 |
2 |
* |
|
1997 Sep 18-20 ^ |
50 |
42 |
6 |
2 |
|
1994 Nov 12-Dec 3 ‡ |
46 |
47 |
-- |
7 |
|
1992 Oct 2-4 ^ |
42 |
51 |
5 |
2 |
|
1983 Nov 11-20 ? |
45 |
47 |
5 |
3 |
|
1982 Jun 26-28 ^ |
48 |
47 |
-- |
5 |
|
1979 Oct 6-20 ‡ |
46 |
51 |
-- |
3 |
|
1978 Jan 7-21 ‡ |
49 |
45 |
-- |
6 |
|
1974 Apr ‡ |
36 |
60 |
-- |
4 |
|
|
|
|
|
|
|
* Less than 0.5% |
||||
|
^ CBS News Poll |
||||
|
† Los Angeles Times Poll |
||||
|
‡ Roper Organization Poll |
||||
|
? CBS News/New York Times Poll |
||||
|
? New York Times |
||||
