GALLUP NEWS SERVICE
PRINCETON, NJ -- Americans' opinions about New York Sen. and presidential candidate Hillary Clinton mirror the underlying partisan divide in the American population today. According to an analysis of a special aggregated sample of more than 7,000 interviews in which Americans were asked to rate Clinton, all conducted between June and September of this year, the public is split precisely down the middle when asked whether its opinions of Clinton are favorable or unfavorable.
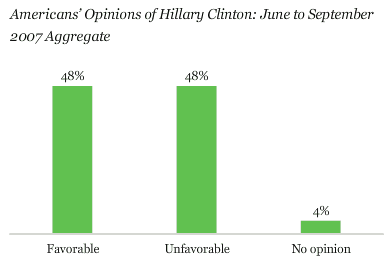
Forty-eight percent of Americans have a favorable opinion of Clinton, while 48% have an unfavorable opinion. Only 4% don't have an opinion of Clinton, making her one of the nation's most well-recognized (and polarizing) political figures.
But just who is most likely to have a favorable opinion of Clinton, and who is least likely to have a favorable opinion?
To help answer that question, Gallup analyzed opinions of Clinton among a large number of subgroups of the American population, based on age, gender, education, race, region, church attendance, income, marital status, partisanship, and ideology. All of the results are from the large 7,000-case sample of interviews conducted from June through September.
The accompanying graph displays -- in descending order -- the subgroups of Americans that are at or above the 48% overall average favorable opinion of Clinton.
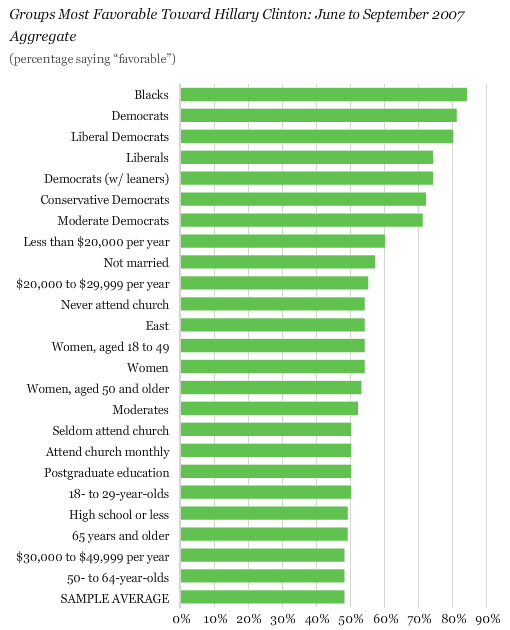
It is immediately apparent that there are three major variables highly related to opinions of Clinton in today's America: the respondent's party identification, the respondent's self-reported ideology, and race. Note for example that blacks', Democrats', and liberal Democrats' ratings of Clinton are more than 30 percentage points more positive than the sample average.
Beyond members of groups defined by these three variables, however, differences in favorable ratings of Clinton across subgroups are relatively small. Most of the other groups in the graph have average ratings fewer than 10 points above the 48% average for the sample. Women, for example, have a favorable rating of Clinton just six points above the national average. While this is significantly different from the rating among men (who, as will be seen, are below average in their ratings of Clinton), the gender gap is much, much smaller than the party or ideology gap. Similarly, those who live in the East -- which encompasses New York, the state Clinton serves -- give Clinton a favorable rating just six points higher than average.
Many of the observed differences are significant from a statistical perspective, given the large size of the data set; however, a rating six points above the average seems less substantively significant, especially when evaluated against the large differences in party and ideology.
For the most part, subgroups with below-average favorable ratings of Clinton are the obverse of the groups above. For example, because roughly half of the sample is women and half men, the fact that women are above average in favorable opinions of Clinton means that men must mathematically be below average.
The rank-ordered listing of groups with below-average favorable ratings of Clinton is displayed in the graph.
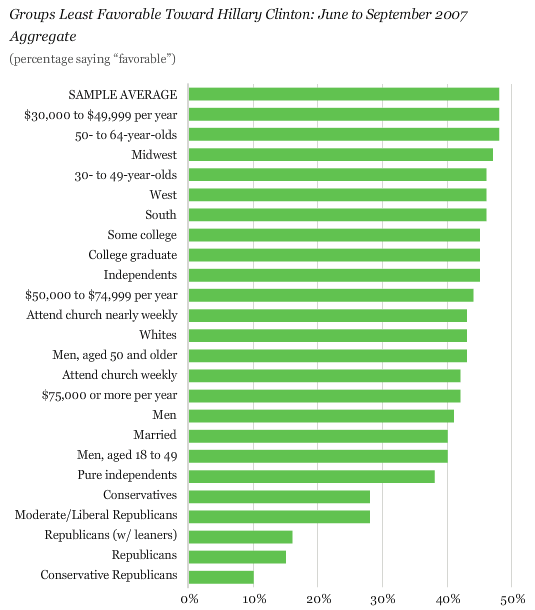
Once again, it is apparent that party affiliation and ideology are the major factors driving Americans' opinions of Clinton. The groups at the bottom of the graph -- that is, those with the lowest favorable opinions of Clinton -- consist of Republicans and conservatives.
In general, Americans who are married, men, more religious, those with higher incomes, and whites are least likely to be positive about Clinton. But many of the differences between their ratings and the average rating are slight.
It is important to note that a number of the subgroup differences in opinions of Clinton seem to be primarily determined by political party. For example, women are more likely than men in America today to be Democrats, and the former are also -- as seen above -- more likely to have positive opinions of Clinton. Men, who are more likely to be Republicans, are below average in their opinions of her. The question therefore remains: Is there a gender gap in opinions of Clinton above and beyond the party effect per se?
To help answer this type of question, the accompanying graphs show subgroup differences in opinions of Clinton among just Democrats/Democratic-leaning independents and among Republicans/Republican-leaning independents.
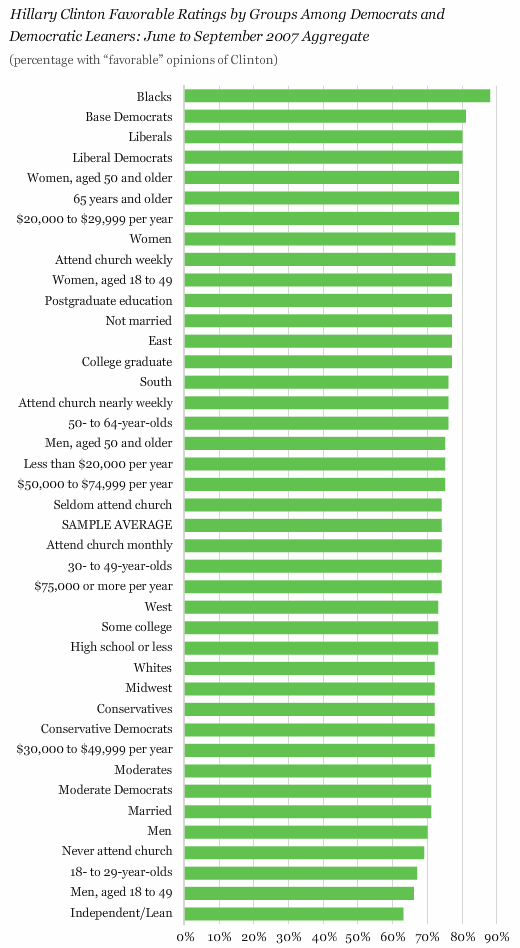
In this graph, which displays opinions of Clinton among various subgroups of Democrats, there is much more subdued variation. On average, 74% of all Democrats have favorable opinions of Clinton, and other than blacks (with an 88% favorable rating), the groups that are the most favorable toward Clinton are base Democrats (those who identify themselves as Democrats before being asked which way they lean) and liberals, and these groups are only six to seven points higher than the Democratic average. At the other end of the scale, Democratic-leaning independents are 11 points below average. All other groups are within eight points of the average.
In general, the data show that among Democrats and Democratic-leaning independents, blacks, those who describe themselves as liberal, women, those who are older, those with college educations, and those living in the East and South are among those with at least slightly higher favorable ratings of Clinton than the average for the Democratic group.
Conversely, among this group of Democrats, men, those who are younger, those who don't attend church, moderates, and those who are married are slightly less likely to be favorable in their ratings.
The final graph shows the favorable ratings of Clinton among Republicans and Republican-leaning independents.
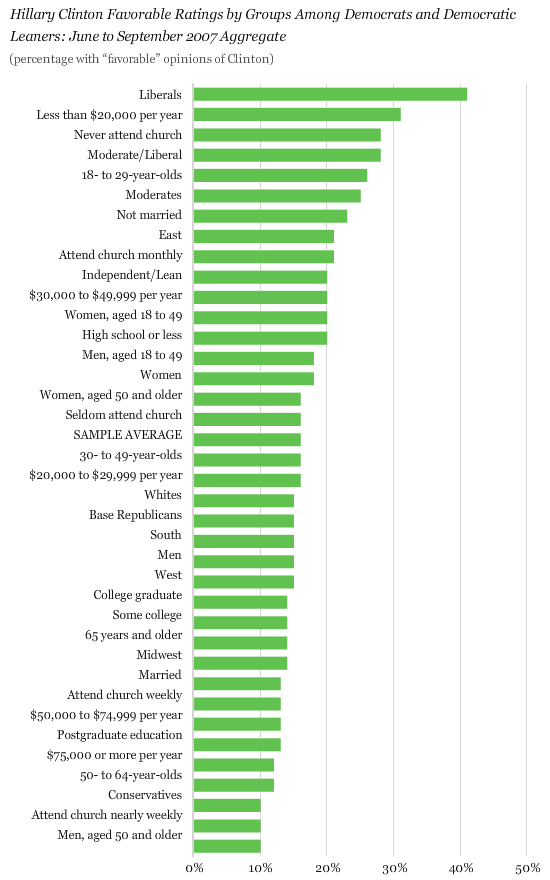
The average favorable rating of Clinton among this group of Republicans is a very low 16%. Note that the small group of Republicans who describe themselves as liberals (just 131 out of the more than 7,000 respondents in the data set being analyzed for this project) is, on a relative basis, the most positive about Clinton. Otherwise, all but a few of the remaining subgroups are within 10 points of the sample average. Republicans who are most positive about Clinton include those who don't attend church, moderates or liberals, those who are younger, those who are not married, and those living in the East. Republicans who are least positive about Clinton include older men and conservatives.
Bottom Line
Hillary Clinton is one of a group of starkly polarizing figures on the American political scene today. Exactly as many Americans have a favorable opinion as have an unfavorable opinion of the New York senator, and only a small percentage don't have an opinion at all.
Clinton's lengthy presence in the public eye and her strong identification as a Democrat -- going back to her eight years in the Democratic White House of her husband Bill -- have led to a situation in which the public appears to evaluate her largely through a political and ideological lens. One's political party and ideological identification are overwhelmingly the most important predictors of where one stands on Clinton. Once these variables are taken into account, there is only modest variation in opinions of Clinton based on such traditional variables as age, gender, socioeconomic status, and region of the country. One exception is race; even among Democrats, blacks are substantially above average in their positive opinions of Clinton.
Survey Methods
Results are based on telephone interviews with 7,094 national adults, aged 18 and older, conducted across seven surveys from the beginning of June 2007 through September 2007. For results based on this total sample of national adults, one can say with 95% confidence that the margin of sampling error is ±1 percentage point.
Margins of error for the various subgroups will be larger than the margin of error for the entire sample.
In addition to sampling error, question wording and practical difficulties in conducting surveys can introduce error or bias into the findings of public opinion polls.
