GALLUP NEWS SERVICE
PRINCETON, NJ -- Most Americans rate both their physical and mental health as excellent or good, while very few people rate either condition as poor. Still, more Americans give high ratings to their mental than to their physical health. A recent Gallup poll focusing on Americans' health also shows that a substantial majority of Americans say they have lost no days in the past month due to health problems, although a small percentage have.
Not surprisingly, younger people are more likely to give high marks to their health than are older people, and are also less likely than older people to report having physical disabilities and long-term medical conditions. But younger people are more likely to report short-term illnesses in the past month. Men are slightly more likely to assess their health in positive terms than are women.
About Eight in 10 Americans Rate Physical and Mental Health as Excellent or Good
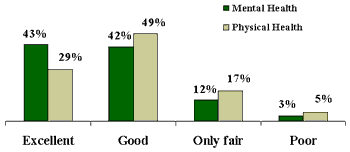
According to the poll, conducted Nov. 8-11, 78% of all Americans rate their physical health as either excellent (29%) or good (49%). An additional 17% say their physical health is only fair, while just 5% say it is poor. A somewhat larger percentage, 85%, give high marks to their mental health, with 43% saying it is excellent and 42% good. Another 12% say their mental health is only fair, and just 3% say poor.
| How would you describe your own (physical/mental) health at this time? Would you say it is -- excellent, good, only fair, or poor? |
 |
| Nov 8-11, '01 |
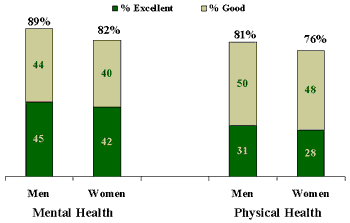
There are only slight differences between men and women in the ratings given to their physical and mental health. Among men, 81% rate their physical health as excellent or good, compared with 76% of women. Similarly, a few more men rate their mental health as excellent or good (89%) than do women (82%).
| Mental/Physical Health Rating by Gender |
 |
| Nov 8-11, '01 |
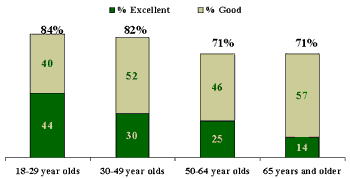
As might be expected, there are differences in these self-perceived health measures by age category. Younger Americans are more positive than are older Americans. From a broad perspective, the biggest difference in the combined "excellent" and "good" rating comes between those under 50 and those 50 and older. Age differences are even more dramatic when we look at just the percentage within each age group who rate their health "excellent."
Eighty-four percent of those under age 30 rate their health as excellent or good, compared with 82% among people 30-49, and 71% among those 50 and older. Forty-four percent of people under 30 give their health an "excellent" rating, compared with just 14% of people 65 and older.
| Physical Health Rating by Age |
 |
| Nov 8-11, '01 |
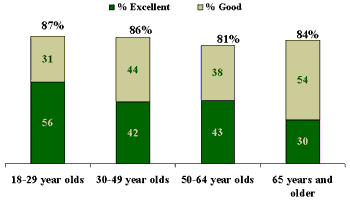
When the top two ratings are combined, there are fewer differences among age groups in their mental health ratings. More than 80% of each age group rates their mental health as excellent or good, although the percentage of excellent ratings declines significantly as people get older. Over half, 56%, of people under 30 rate their mental health as excellent, compared with just 30% of people 65 and older.
| Mental Health Rating by Age |
 |
| Nov 8-11, '01 |
Days Lost Due to Mental and Physical Health Problems
The average American lost 2.3 days of activity in the last month due to poor physical health, and the average number of days lost because of poor mental health was 1.3. These averages can be somewhat misleading, however, since they are caused by a small number of people who miss large numbers of days of activity. Overall, 73% of all Americans say they suffered no days of lost activity last month due to physical health problems, and 85% say that about mental health problems. On the other hand, 13% of Americans have lost five or more days of activity due to physical health problems, and 8% have lost five or more days due to mental health problems.
During the past month, for about how many days did poor physical health keep you from doing your usual activities, such as self-care, work or recreation? [Open-ended and code actual number of days]
During the past month, for about how many days did poor mental health or emotional well-being keep you from doing your usual activities, such as self-care, work or recreation? [Open-ended and code actual number of days]
|
All Adults |
||
|
2001 Nov 8-11 |
Physical health |
Mental health |
|
% |
% |
|
|
None |
73 |
85 |
|
Less than one day |
* |
* |
|
One |
5 |
3 |
|
Two |
4 |
2 |
|
Three |
3 |
1 |
|
Four |
2 |
1 |
|
Five to ten |
6 |
4 |
|
Eleven or more |
7 |
4 |
|
No opinion |
* |
* |
|
Mean |
2.3 |
1.3 |
Physical Disabilities, Long-Term Conditions, and Short-Term Illnesses
A relatively high number of Americans have either a physical disability that limits their activities -- 21% -- or a long-term medical condition -- 28%. Another 24% have been sick with a short-term illness in the past 30 days.
|
Overall |
Age |
||||
|
18-29 |
30-49 |
50-64 |
65+ |
||
|
You have a physical disability that limits your activity |
21% |
12
|
18 |
26 |
32 |
|
You have a long-term medical condition, illness, or disease |
28% |
12
|
26 |
35 |
43 |
|
You have been sick with a short-term illness sometime in the past 30 days |
24% |
31
|
26 |
23 |
16 |
As the chart shows, older people are more likely than younger people to report physical disabilities and long-term medical conditions. However, younger people are slightly more likely than older people to report a short-term illness in the past 30 days.
Survey Methods
These results are based on telephone interviews with a randomly selected national sample of 1,005 adults, 18 years and older, conducted Nov. 8-11, 2001. For results based on this sample, one can say with 95 percent confidence that the maximum error attributable to sampling and other random effects is plus or minus 3 percentage points. In addition to sampling error, question wording and practical difficulties in conducting surveys can introduce error or bias into the findings of public opinion polls.
Next, we have some questions about your personal health that are designed to give us a better understanding of the health problems faced by the American public. First,
How would you describe your own physical health at this time? Would you say your physical health is -- excellent, good, only fair, or poor?
|
Excellent |
Good |
Only fair |
Poor |
No opinion |
|
|
2001 Nov 8-11 |
29% |
49 |
17 |
5 |
* |
Now, thinking about your physical health, for how many days during the past month was your physical health not good? [Open-ended and code actual number of days]
|
2001 Nov 8-11 |
|
|
% |
|
|
None |
52 |
|
Less than one day |
* |
|
One |
7 |
|
Two |
9 |
|
Three |
4 |
|
Four |
3 |
|
Five to ten |
11 |
|
Eleven or more |
12 |
|
No opinion |
2 |
|
Mean |
4.0 |
|
Median |
0 |
During the past month, for about how many days did poor physical health keep you from doing your usual activities, such as self-care, work or recreation? [Open-ended and code actual number of days]
|
2001 Nov 8-11 |
Experienced |
All adults |
|
% |
% |
|
|
None |
43 |
73 |
|
Less than one day |
* |
* |
|
One |
10 |
5 |
|
Two |
8 |
4 |
|
Three |
7 |
3 |
|
Four |
3 |
2 |
|
Five to ten |
14 |
6 |
|
Eleven or more |
14 |
7 |
|
No opinion |
* |
* |
|
Mean |
5.0 |
2.3 |
|
Median |
1 |
0 |
^ BASED ON -- 441 -- WHO EXPERIENCED DAY(S) OF POOR PHYSICAL HEALTH; ±5 PCT. PTS.
Thinking about your own health, which, if any, of the following applies to you? [RANDOM ORDER]
A. You have a physical disability that limits your activity
|
|
Yes |
No |
No opinion |
|
2001 Nov 8-11 |
21% |
79 |
* |
B. You have a long-term medical condition, illness or disease
|
|
Yes |
No |
No opinion |
|
2001 Nov 8-11 |
28% |
72 |
* |
C. You have been sick with a short-term illness sometime in the past 30 days
|
|
Yes |
No |
No opinion |
|
2001 Nov 8-11 |
24% |
76 |
* |
SUMMARY TABLE: HEALTH CONDITIONS
|
2001 Nov 8-11 |
|
|
|
You have a long-term medical condition, illness or disease |
28% |
72 |
|
You have been sick with a short-term illness sometime in the past 30 days |
24% |
76 |
|
You have a physical disability that limits your activity |
21% |
79 |
How would you describe your own mental health or emotional well-being at this time? Would you say it is -- excellent, good, only fair, or poor?
|
Excellent |
Good |
Only fair |
Poor |
No opinion |
|
|
2001 Nov 8-11 |
43% |
42 |
12 |
3 |
* |
Now, thinking about your mental health or emotional well-being, for how many days during the past month was either of these not good? [Open-ended and code actual number of days]
|
2001 Nov 8-11 |
|
|
% |
|
|
None |
62 |
|
Less than one day |
* |
|
One |
5 |
|
Two |
8 |
|
Three |
4 |
|
Four |
2 |
|
Five to ten |
9 |
|
Eleven or more |
8 |
|
No opinion |
2 |
|
Mean |
2.7 |
|
Median |
0 |
During the past month, for about how many days did poor mental health or emotional well-being keep you from doing your usual activities, such as self-care, work or recreation? [Open-ended and code actual number of days]
|
2001 Nov 8-11 |
Experienced |
All adults |
|
% |
% |
|
|
None |
58 |
85 |
|
Less than one day |
* |
* |
|
One |
7 |
3 |
|
Two |
5 |
2 |
|
Three |
4 |
1 |
|
Four |
2 |
1 |
|
Five to ten |
11 |
4 |
|
Eleven or more |
12 |
4 |
|
No opinion |
1 |
* |
|
Mean |
3.7 |
1.3 |
|
Median |
0 |
0 |
^ BASED ON -- 344 -- WHO EXPERIENCED DAY(S) OF POOR MENTAL HEALTH; ±6 PCT. PTS.
* -- Less than 0.5%
