GALLUP NEWS SERVICE
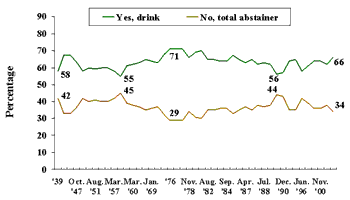
PRINCETON, NJ -- About one-third of all Americans say they never drink alcoholic beverages, but the rest say they do drink on occasion, according to a recent Gallup poll. Over the past six decades, the number of admitted drinkers has varied from a low of 55% (in 1958) to a high of 71% (1976-1978). There doesn't appear to be any clear or consistent pattern that would explain the variations.
| Do You Drink Alcoholic Beverages? |
 |
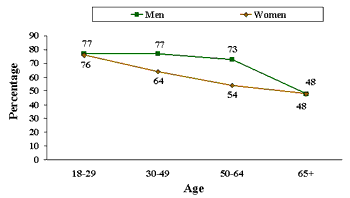
The poll was conducted July 9-11 and shows that the number of drinkers varies considerably between men and women, and among age groups. Overall, 72% of men are drinkers, compared with 60% of women. Also, three-quarters of the youngest age group (those under 30) are drinkers, compared with just under half of the oldest group (65+).
| Percentage of Men and Women Who Are
Drinkers: Compared by Age |
 |
| July 9-11, 2002 |
As shown in the preceding graph, the rates of drinking among the youngest age group of men and women are almost the same (77% and 76%, respectively), and the rates among the oldest group of men and women are identical (48%). However, in the intermediate age groups, drinking rates are higher among men than women. Among women, each older age group shows a decline in the number of drinkers from the group immediately preceding it in age. But among men, the number of drinkers remains about the same for the three lower age groups, and shows a significant decline in only the oldest one.
Men Drink More Than Women Do
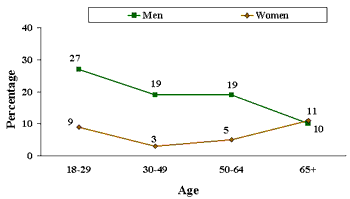
Not only do more men than women drink, men consume more than women do. Over a quarter (27%) of male drinkers average at least one drink a day, compared with just 10% of female drinkers.
When quantity of consumption is compared among all men and women by age groups, it shows that young men (27%) are three times as likely to average one drink a day as are young women (9%). By the time men and women reach retirement age, however, they are about equal in the percentage who average a drink a day (11% among women, 10% among men).
| Percentage Who Average One Drink Per Day: Compared by Age and Gender |
 |
| July 9-11, 2002 |
Men Mostly Drink Beer; Women Tend Toward Wine
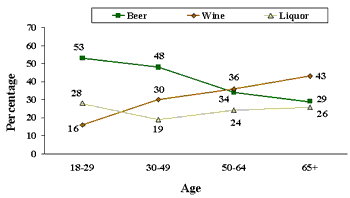
The poll shows that most men love their beer, while women are more eclectic in their tastes. Six in 10 male drinkers say they most often drink beer, with 16% saying wine and 19% liquor. The preferred drink among female drinkers is wine (46%), with the rest splitting their tastes between beer (25%) and liquor (27%).
The affinity for beer declines with age, from 53% among the youngest drinkers to 29% among the oldest ones. At the same time, wine's popularity increases, from 16% in the youngest age group to 43% in the oldest group. Liquor shows a slight decrease in popularity after people reach 30, and then remains the favorite among a quarter of drinkers in the older age groups.
| Alcohol Preference Compared by Age |
 |
| July 9-11, 2002 |
Men and Young People Most Likely to Drink Too Much
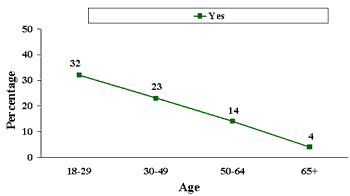
Given that men drink much more frequently than women, and that younger people drink more frequently than older people, it is not surprising that these two groups of heavier drinkers are also more likely to say they sometimes drink more than they should. About twice as many male drinkers (28%) admit to overdrinking as do female drinkers (13%). Also, 32% of younger people admit to drinking too much, compared with 23% in the 30-49 age group, 14% in the 50-64 group, and just 4% of people 65 and older.
| Percentage of Drinkers Who Say They Sometimes Drink Too Much: Compared by Age |
 |
| July 9-11, 2002 |
Although men are more likely than women to admit to drinking, and to drinking too much, men are somewhat less likely than women to say that alcohol has ever been a cause of trouble in their family. Overall, 28% of all adults make that claim: 31% of women, compared with 25% of men.
Survey Methods
The results reported here are based on telephone interviews with a randomly selected national sample of 1,004 adults, 18 years and older, conducted July 9-11, 2002. For results based on this sample, one can say with 95 percent confidence that the maximum error attributable to sampling and other random effects is plus or minus 3 percentage points. In addition to sampling error, question wording and practical difficulties in conducting surveys can introduce error or bias into the findings of public opinion polls.
Now turning to a different subject,
Do you have occasion to use alcoholic beverages such as liquor, wine or beer, or are you a total abstainer?
|
Yes, |
No, total abstainer |
||
|
% |
% |
||
|
2002 Jul 9-11 |
66 |
34 |
|
|
2001 Jul 19-22 |
62 |
38 |
|
|
2000 Nov 13-15 |
64 |
36 |
|
|
1999 Sep 23-26 |
64 |
36 |
|
|
1997 Jun 26-29 |
61 |
39 |
|
|
1996 Jun 27-30 |
58 |
42 |
|
|
1994 Jun 3-6 |
65 |
35 |
|
|
1992 Jan 16-19 |
64 |
35 |
|
|
1990 Dec 6-9 |
57 |
43 |
|
|
1989 Sep 12-15 |
56 |
44 |
|
|
1989 Apr 4-9 |
62 |
38 |
|
|
1988 Jul 1-7 |
63 |
37 |
|
|
1988 Mar 8-12 |
62 |
38 |
|
|
1987 Jul 10-13 |
65 |
35 |
|
|
1987 Apr 10-13 |
63 |
37 |
|
|
1987 Mar 14-18 |
65 |
35 |
|
|
1985 Feb 15-18 |
67 |
33 |
|
|
1984 Sep 6-9 |
64 |
36 |
|
|
1984 Jul 6-9 |
64 |
36 |
|
|
1983 Mar 11-14 |
65 |
35 |
|
|
1982 Aug 13-16 |
65 |
35 |
|
|
1981 Jan 9-12 |
70 |
30 |
|
|
1979 May 4-7 |
69 |
31 |
|
|
1978 Nov 10-13 |
66 |
34 |
|
|
1978 Apr 21-24 |
71 |
29 |
|
|
1977 Jan 14-17 |
71 |
29 |
|
|
1976 |
71 |
29 |
|
|
1974 May 10-13 |
68 |
32 |
|
|
1969 Jan 1-6 |
64 |
36 |
|
|
1969 Feb 22-27 |
63 |
37 |
|
|
1966 Jan 21-26 |
65 |
35 |
|
|
1964 |
63 |
37 |
|
|
1960 Mar 30-Apr 4 |
62 |
38 |
|
|
1959 Dec 10-15 |
61 |
39 |
|
|
1958 Jan 24-29 |
55 |
45 |
|
|
1957 Mar 15-20 |
58 |
42 |
|
|
1956 Jan 6-11 |
60 |
40 |
|
|
1952 Dec 11-16 |
60 |
40 |
|
|
1951 Aug 26-31 |
59 |
41 |
|
|
1950 Jun 4-9 |
60 |
40 |
|
|
1949 Dec 1-6 |
58 |
42 |
|
|
1947 Oct 3-8 |
63 |
37 |
|
|
1946 Jul 26-31 |
67 |
33 |
|
|
1945 Nov 23-28 |
67 |
33 |
|
|
1939 |
58 |
42 |
|
When did you last take a drink of any kind of alcoholic beverage?
BASED ON -- 673 -- WHO DRINK ALCOHOLIC BEVERAGES
|
|
Over 1 day |
Over 1 |
|
|
|
% |
% |
% |
% |
|
|
2002 Jul 9-11 |
28 |
38 |
34 |
* |
|
2001 Jul 19-22 |
30 |
32 |
38 |
* |
|
200 Nov 13-15 |
26 |
32 |
42 |
* |
|
1999 Sep 23-26 |
35 |
25 |
39 |
1 |
|
1997 Jun 26-29 |
33 |
25 |
42 |
* |
|
1996 Jun 27-30 |
28 |
26 |
45 |
1 |
|
1994 Jun 3-6 |
34 |
23 |
42 |
1 |
|
1992 Jan 16-19 |
26 |
24 |
49 |
1 |
|
1990 Dec 6-9 |
29 |
23 |
47 |
1 |
|
1989 Sep 12-15 |
32 |
35 |
32 |
1 |
|
1988 Jul 1-7 |
39 |
25 |
34 |
2 |
|
1987 Jul 10-13 |
38 |
30 |
31 |
1 |
|
1984 Jul 6-9 |
39 |
29 |
31 |
1 |
|
* Less than 0.5% |
||||
Approximately how many drinks of any kind of alcoholic beverages did you drink in the past SEVEN days?
BASED ON -- 673 -- WHO DRINK ALCOHOLIC BEVERAGES
|
0 |
1-7 |
8-19 |
20+ |
Don't know |
|
|
% |
% |
% |
% |
% |
|
|
2002 Jul 9-11 |
34 |
50 |
9 |
5 |
2 |
|
2001 Jul 19-22 |
39 |
48 |
9 |
4 |
* |
|
2000 Nov 13-15 |
43 |
46 |
8 |
3 |
* |
|
1999 Sep 23-26 |
40 |
47 |
8 |
4 |
* |
|
1997 Jun 26-29 |
41 |
45 |
8 |
5 |
1 |
|
1996 Jun 27-30 |
47 |
42 |
7 |
2 |
2 |
|
1994 Jun 3-6 |
44 |
42 |
10 |
3 |
1 |
|
1992 Jan 16-19 |
51 |
36 |
10 |
2 |
1 |
|
1990 Dec 6-9 |
50 |
40 |
6 |
3 |
1 |
|
1989 Sep 12-15 |
33 |
47 |
13 |
5 |
2 |
|
1988 Jul 1-7 |
32 |
49 |
10 |
6 |
3 |
|
1987 Jul 10-13 |
29 |
50 |
11 |
6 |
4 |
|
* Less than 0.5% |
|||||
Do you most often drink liquor, wine, or beer?
BASED ON -- 673 -- WHO DRINK ALCOHOLIC BEVERAGES
|
|
|
|
ALL/ |
|
No opinion |
|
|
% |
% |
% |
% |
% |
% |
|
|
2002 Jul 9-11 |
22 |
30 |
44 |
3 |
1 |
* |
|
2001 Jul 19-22 |
18 |
31 |
46 |
4 |
* |
1 |
|
2000 Nov 13-15 |
22 |
31 |
43 |
3 |
0 |
1 |
|
1999 Sep 23-26 |
19 |
34 |
42 |
4 |
* |
1 |
|
1997 Jun 26-29 |
18 |
32 |
45 |
4 |
* |
1 |
|
1996 Jul 25-28 |
20 |
27 |
46 |
6 |
0 |
1 |
|
1994 Jun 3-6 |
18 |
29 |
47 |
3 |
1 |
2 |
|
1992 Jan 16-19 |
21 |
27 |
47 |
3 |
1 |
1 |
|
(vol.) Volunteered response |
||||||
|
* Less than 0.5% |
||||||
Do you sometimes drink more alcoholic beverages than you think you should?
BASED ON -- 673 -- WHO DRINK ALCOHOLIC BEVERAGES
|
Yes |
No |
No opinion |
|
|
% |
% |
% |
|
|
2002 Jul 9-11 |
21 |
79 |
* |
|
2001 Jul 19-22 |
20 |
80 |
* |
|
2000 Nov 13-15 |
26 |
74 |
* |
|
1999 Sep 23-26 |
24 |
76 |
* |
|
1997 Jun 26-29 |
22 |
78 |
* |
|
1996 Jul 25-28 |
25 |
75 |
* |
|
1994 Jun 3-6 |
29 |
71 |
0 |
|
1992 Jan 16-19 |
29 |
71 |
-- |
|
1990 Dec 6-9 |
23 |
76 |
1 |
|
1989 Sep 12-15 |
35 |
65 |
-- |
|
1987 Jul 1-7 |
29 |
71 |
-- |
|
1985 Feb 15-18 |
32 |
68 |
-- |
|
1978 Nov 10-13 |
23 |
77 |
-- |
Has drinking ever been a cause of trouble in your family?
|
Yes |
No |
No answer |
|
|
% |
% |
% |
|
|
2002 Jul 9-11 |
28 |
72 |
* |
|
2001 Jul 19-22 |
36 |
64 |
* |
|
2000 Nov 13-15 |
36 |
64 |
* |
|
1999 Sep 23-26 |
36 |
64 |
* |
|
1997 Jun 26-29 |
30 |
70 |
* |
|
1996 Jun 27-30 |
23 |
77 |
* |
|
1994 Jun 3-6 |
27 |
72 |
1 |
|
1992 Jan 16-19 |
24 |
76 |
-- |
|
1990 Dec 6-9 |
23 |
76 |
1 |
|
1989 Sep 12-15 |
19 |
81 |
-- |
|
1987 Mar 14-18 |
24 |
76 |
-- |
|
1985 Feb 15-18 |
21 |
79 |
-- |
|
1984 Jul 6-9 |
18 |
82 |
-- |
|
1981 |
22 |
78 |
-- |
|
1978 |
22 |
78 |
-- |
|
1976 |
17 |
83 |
-- |
|
1974 |
12 |
88 |
-- |
|
1966 |
12 |
88 |
-- |
|
1947 |
15 |
85 |
-- |
|
* Less than 0.5% |
|||
