GALLUP NEWS SERVICE
PRINCETON, NJ -- The latest Gallup Poll shows a majority of Americans have favorable views of both the Republican and Democratic Parties. The public sees the Republicans as better able to protect the country from terrorism and military threats, but neither party has an advantage in terms of being able to keep the country prosperous. Recent polls show slightly more Americans identifying themselves as Democrats than as Republicans, reversing a trend that had been evident in Gallup Polls in late 2001 and early 2002. And with the midterm elections less than two months away, the Democratic Party continues to have a small lead in Gallup's "generic" congressional ballot.
Post-Sept. 11 Rally Effect Fading for Republicans
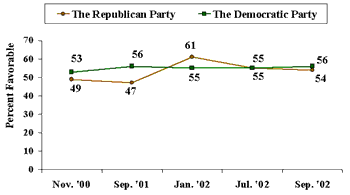
The poll, conducted Sept. 5-8, asked the public if it has a favorable or an unfavorable view of the two major political parties. A majority of Americans have a favorable view of each party (54% for the Republican Party and 56% for the Democratic Party), with neither party holding an advantage on this measure.
The Republican Party's ratings benefited from the post-Sept. 11 rally effect, most vividly reflected in George W. Bush's sky-high job approval ratings. However, the effects of that rally have dissipated for the Republican Party, as they have on most measures that increased after the terrorist attacks, though the Republican Party is still viewed more favorably now than prior to the attacks. Interestingly, the Democratic Party did not appear to benefit perceptually from the war on terror, even though most measures of support for the government -- including overall trust in it and congressional job approval -- saw gains in the aftermath of Sept. 11.
| Favorable Ratings for Two Major Political Parties |
 |
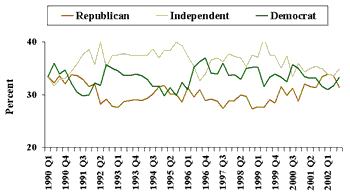
Following the terrorist attacks, Gallup polling consistently showed more Americans identifying themselves as Republicans than as Democrats. This rare phenomenon has been witnessed only twice in the last decade: during the Persian Gulf War and following the Republican congressional victories in 1994. In the fourth quarter of 2001, the Republicans overtook the Democrats, and maintained a two- to three-point edge in party identification in the first two quarters of 2002. However, in the current quarter, Democrats have moved back ahead of Republicans by a slight 33% to 31% margin, with 35% identifying themselves as independents.
| Political Party Identification by Quarter |
 |
Republican Party Has Edge on International Issues
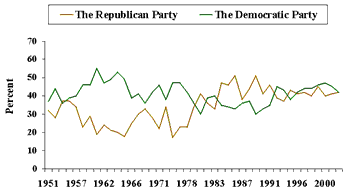
The most recent poll updated a Gallup question first asked in 1951: Which party is better able to keep the country prosperous? Currently, the public is evenly divided in its response, with 42% saying the Democratic Party and 42% saying the Republican Party. Perceptions have shifted over the years. The Republicans held an advantage throughout most of the 1980s while the Democrats had the advantage in the 1960s. In more recent years (since 2000), the Democratic Party has held a slight edge.
| Which Political Party Can Better Keep the Country Prosperous? |
 |
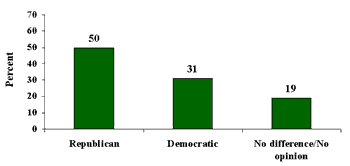
In the current poll, for the first time, Gallup asked the public which party would do a better job of protecting the country from international terrorism and military threats. Here, the Republican Party holds a clear advantage of 50% to 31%. These results are consistent with Gallup polling earlier this year showing the Republicans generally being viewed as better equipped to handle military and foreign policy matters.
| Which Political Party Can Better Protect the Country From International Terrorism and Military Threats? |
 |
| Sep. 5-8, 2002 |
Democrats Lead in Generic Congressional Ballot
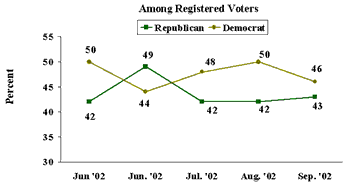
A Sept. 2-4 CNN/USA Today/Gallup Poll shows that 46% of registered voters say they will vote for the Democratic Party's candidate in their congressional district, and 43% will vote for the Republican Party's candidate (11% are undecided). The Democrats have led in the last three readings on this generic congressional ballot measure, and on four of the last five readings -- all taken since June. At this point, most experts expect the race for control of both the House and Senate to be very close, seeing few "competitive" races in individual districts or states.
| Vote for Congress If the elections for Congress were being held today, which party's candidate would you vote for in your congressional district? |
 |
In 1998 and 1994, the congressional generic ballot as measured in the September before the election gave a fairly accurate indication of the way the election would turn out. In 1998, Democrats led throughout September. While they did not gain control of Congress and the final overall congressional vote was a virtual tie, they performed better than expected in the elections, becoming the first party since 1934 to gain seats in a midterm election while a president of their party was in the White House. In 1994, Republicans held a slight edge in September on their way to a big victory that allowed them to take control of the House of Representatives for the first time since 1954. In 1990, the September data showed a Democratic edge in a year when the Democrats won comfortably.
Public Shows No Consensus on Divided Government
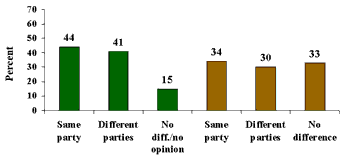
Should Democrats regain control of the House or maintain control of the Senate, or do both, President Bush will be faced with two more years of divided government. Since 1980, there have been only three full years (1980, 1993, 1994) and part of one year (2001) when one party had control of the presidency and both houses of Congress. But the public continues to be divided in its view of whether divided government or single-party control is better. The Sept. 5-8 poll shows 44% of Americans saying it is better to have a president and Congress from the same party, 41% saying it is better to have a president and Congress from different parties, and 15% volunteer that it does not make a difference or they have no opinion. When people are given the explicit option to say that it doesn't make a difference, 33% choose this option, while 34% say one-party control is better and 30% say two-party control is better. The results are consistent with recent polling on the topic, but in the early 1990s, Americans showed a preference for one-party government.
| Better to Control Congress and Presidency |
 |
| Sep. 5-8, 2002 |
Survey Methods
These results are based on telephone interviews with a randomly selected national sample of 1,003 adults, 18 years and older, conducted Sept. 5-8, 2002. For results based on this sample, one can say with 95 percent confidence that the maximum error attributable to sampling and other random effects is plus or minus 3 percentage points. The results on 840 registered voters are based on interviews conducted Sept. 2-4, 2002, and have a margin of error of plus or minus 4 percentage points. In addition to sampling error, question wording and practical difficulties in conducting surveys can introduce error or bias into the findings of public opinion polls.
Next, please tell me whether you have a favorable or unfavorable opinion of each of the following parties. How about -- [ITEMS ROTATED]?
A. The Republican Party
|
Favorable |
Unfavorable |
NEVER HEARD OF (vol.) |
No opinion |
|
|
% |
% |
% |
% |
|
|
(NA) 2002 Sep 5-8 |
54 |
40 |
0 |
6 |
|
(NA) 2002 Jul 26-28 |
55 |
36 |
* |
9 |
|
(NA) 2002 Jan 11-14 |
61 |
30 |
* |
9 |
|
(NA) 2001 Sep 7-10 |
47 |
48 |
* |
5 |
|
(NA) 2000 Nov 13-15 |
49 |
43 |
* |
8 |
|
(NA) 2000 Aug 4-5 |
54 |
37 |
1 |
8 |
|
(NA) 2000 Jul 25-26 |
49 |
39 |
* |
12 |
|
(NA) 2000 Jan 7-10 |
53 |
41 |
* |
6 |
|
(NA) 1999 Nov 18-21 |
50 |
44 |
* |
6 |
|
(NA) 1999 Apr 30-May 2 |
47 |
44 |
* |
9 |
|
(NA) 1999 Feb 19-21 |
45 |
46 |
0 |
9 |
|
(NA) 1999 Feb 12-13 |
40 |
54 |
1 |
5 |
|
(NA) 1999 Feb 4-8 |
45 |
47 |
* |
8 |
|
(NA) 1999 Jan 8-10 |
40 |
52 |
* |
8 |
|
(NA) 1998 Dec 19-20 |
31 |
57 |
* |
12 |
|
(NA) 1998 Dec 15-16 |
43 |
47 |
2 |
8 |
|
(NA) 1997 Oct 27-29 |
50 |
42 |
* |
8 |
|
(RV) 1996 Aug 30-Sep 1 |
50 |
45 |
* |
5 |
|
(RV) 1996 Aug 16-18 |
55 |
41 |
1 |
2 |
|
(RV) 1996 Aug 5-7 |
51 |
44 |
* |
5 |
|
(NA) 1996 Apr 9-10 |
52 |
41 |
* |
7 |
|
(NA) 1995 Apr 17-19 |
52 |
42 |
* |
6 |
|
(RV) 1992 Jul 6-8 |
53 |
39 |
* |
8 |
B. The Democratic Party
|
Favorable |
Unfavorable |
NEVER HEARD OF (vol.) |
No opinion |
|
|
% |
% |
% |
% |
|
|
(NA) 2002 Sep 5-8 |
56 |
38 |
0 |
6 |
|
(NA) 2002 Jul 26-28 |
55 |
34 |
* |
11 |
|
(NA) 2002 Jan 11-14 |
55 |
33 |
* |
12 |
|
(NA) 2001 Sep 7-10 |
56 |
38 |
* |
6 |
|
(NA) 2000 Nov 13-15 |
53 |
38 |
1 |
8 |
|
(NA) 2000 Aug 4-5 |
53 |
38 |
1 |
8 |
|
(NA) 2000 Jul 25-26 |
56 |
35 |
* |
9 |
|
(NA) 2000 Jan 7-10 |
61 |
33 |
* |
6 |
|
(NA) 1999 Nov 18-21 |
51 |
41 |
* |
8 |
|
(NA) 1999 Apr 30-May 2 |
53 |
37 |
1 |
9 |
|
(NA) 1999 Feb 19-21 |
55 |
37 |
0 |
8 |
|
(NA) 1999 Feb 12-13 |
56 |
38 |
* |
6 |
|
(NA) 1999 Feb 4-8 |
57 |
37 |
* |
6 |
|
(NA) 1999 Jan 8-10 |
57 |
35 |
* |
8 |
|
(NA) 1998 Dec 19-20 |
57 |
30 |
* |
13 |
|
(NA) 1998 Dec 15-16 |
58 |
32 |
2 |
8 |
|
(NA) 1997 Oct 27-29 |
54 |
39 |
* |
7 |
|
(RV) 1996 Aug 30-Sep 1 |
60 |
36 |
* |
4 |
|
(RV) 1996 Aug 16-18 |
55 |
41 |
1 |
3 |
|
(RV) 1996 Aug 5-7 |
57 |
38 |
1 |
4 |
|
(NA) 1996 Apr 9-10 |
55 |
38 |
0 |
7 |
|
(NA) 1995 Apr 17-19 |
51 |
43 |
* |
6 |
|
(RV) 1992 Jul 6-8 |
54 |
38 |
* |
8 |
|
(NA) National Adults |
||||
|
(RV) Registered Voters |
||||
|
(vol.) Volunteered response |
||||
|
* Less than 0.5% |
||||
Looking ahead for the next few years, which political party do you think will do a better job of protecting the country from international terrorism and military threats -- [ROTATED: the Republican Party or the Democratic Party]?
|
|
|
NO DIFFERENCE (vol.)/No opinion |
|
|
% |
% |
% |
|
|
2002 Sep 5-8 |
50 |
31 |
19 |
Looking ahead for the next few years, which political party do you think will do a better job of keeping the country prosperous -- [ROTATED: the Republican Party or the Democratic Party]?
|
Republican |
Democratic |
NO DIFFERENCE (vol.)/No opinion |
||
|
2002 |
||||
|
2002 Sep 5-8 |
42 |
42 |
16 |
|
|
2001 |
||||
|
2001 Sep 7-10 |
41 |
45 |
14 |
|
|
2000 |
||||
|
2000 Oct 6-9 |
40 |
47 |
13 |
|
|
1999 |
||||
|
1999 Oct 8-10 |
45 |
46 |
9 |
|
|
1998 |
||||
|
1998 Oct 29-Nov 1 |
37 |
46 |
17 |
|
|
1998 Apr 17-19 |
43 |
42 |
15 |
|
|
1997 |
||||
|
1997 Oct 27-29 |
42 |
44 |
14 |
|
|
1996 |
||||
|
1996 Jul 25-28 |
41 |
42 |
17 |
|
|
1994 |
||||
|
1994 Sep 23-25 |
48 |
38 |
14 |
|
|
1994 Aug 15-16 |
42 |
36 |
22 |
|
|
1994 Aug 8-9 |
41 |
36 |
23 |
|
|
1994 May 20-22 |
40 |
42 |
18 |
|
|
1993 |
||||
|
1993 Aug 8-10 |
36 |
39 |
25 |
|
|
1993 Mar 22-24 |
38 |
46 |
16 |
|
|
1992 |
||||
|
1992 Oct 23-25 |
37 |
45 |
18 |
|
|
1992 Sep 11-15 |
39 |
48 |
13 |
|
|
1992 Jul 17-18 |
32 |
53 |
15 |
|
|
1992 Jul 6-8 |
42 |
38 |
20 |
|
|
1992 Mar 20-22 |
43 |
42 |
15 |
|
|
1992 Feb 6-9 |
41 |
43 |
16 |
|
|
1991 |
||||
|
1991 Jul 18-21 |
49 |
32 |
19 |
|
|
1991 Oct 24-27 |
44 |
41 |
15 |
|
|
1991 Mar 21-24 |
46 |
31 |
23 |
|
|
1990 |
||||
|
1990 Aug 9-12 |
45 |
30 |
25 |
|
|
1990 Oct 25-28 |
37 |
35 |
28 |
|
|
1989 |
||||
|
1989 Jul 18-21 |
51 |
30 |
19 |
|
|
1988 |
||||
|
1988 Sep 9-11 |
52 |
34 |
14 |
|
|
1988 May 13-15 |
39 |
41 |
20 |
|
|
1988 Jan 22-24 |
42 |
35 |
23 |
|
|
1987 |
||||
|
1987 Dec 4-6 |
41 |
38 |
21 |
|
|
1987 Oct 23-26 |
40 |
33 |
27 |
|
|
1987 Jul 10-13 |
34 |
36 |
30 |
|
|
1987 Jan 16-19 |
38 |
37 |
25 |
|
|
1986 |
||||
|
1986 Mar 7-10 |
51 |
33 |
16 |
|
|
1985 |
||||
|
1985 Jun 7-10 |
44 |
35 |
21 |
|
|
1985 Mar 8-11 |
48 |
32 |
20 |
|
|
1984 |
||||
|
1984 Sep 7-10 |
49 |
33 |
18 |
|
|
1984 Aug 10-13 |
48 |
36 |
24 |
|
|
1984 Apr 6-9 |
44 |
36 |
20 |
|
|
1983 |
||||
|
1983 Sep 6-9 |
33 |
40 |
27 |
|
|
1982 |
||||
|
1982 Oct 15-18 |
34 |
43 |
23 |
|
|
1982 Jun 25-28 |
43 |
33 |
24 |
|
|
1982 Feb 5-8 |
32 |
42 |
26 |
|
|
1981 |
||||
|
1981 Oct 2-5 |
41 |
31 |
28 |
|
|
1981 Apr 10-13 |
41 |
28 |
31 |
|
|
1980 |
||||
|
1980 Oct 10-13 |
35 |
36 |
29 |
|
|
1980 Sep 12-15 |
35 |
36 |
29 |
|
|
1980 Jun 27-30 |
31 |
37 |
32 |
|
|
Republican |
Democratic |
NO DIFFERENCE (vol.)/No opinion |
||
|
1978 |
||||
|
1978 Oct 27-30 |
27 |
38 |
35 |
|
|
1978 Jul 21-24 |
26 |
40 |
34 |
|
|
1978 |
||||
|
1978 Mar 3-6 |
23 |
42 |
35 |
|
|
1976 |
||||
|
1976 Aug 27-30 |
23 |
47 |
30 |
|
|
1974 |
||||
|
1974 Sep 27-30 |
17 |
47 |
36 |
|
|
1972 |
||||
|
1972 Oct 13-16 |
38 |
33 |
29 |
|
|
1972 Sep 22-25 |
38 |
35 |
27 |
|
|
1972 Aug 4-7 |
33 |
39 |
28 |
|
|
1972 Apr 21-24 |
25 |
44 |
31 |
|
|
1971 |
||||
|
1971 Aug 27-30 |
21 |
46 |
33 |
|
|
1971 Jul 15-18 |
22 |
46 |
32 |
|
|
1970 |
||||
|
1970 Aug 25-Sep 1 |
26 |
40 |
34 |
|
|
1970 Jun 18-23 |
29 |
44 |
27 |
|
|
1968 |
||||
|
1968 Oct 17-22 |
34 |
37 |
29 |
|
|
1968 Sep 1-6 |
32 |
34 |
34 |
|
|
1967 |
||||
|
1967 Jun 2-7 |
30 |
41 |
29 |
|
|
1966 |
||||
|
1966 Oct 1-6 |
24 |
39 |
37 |
|
|
1966 Sep 8-13 |
24 |
41 |
35 |
|
|
1966 Jun 16-21 |
26 |
38 |
36 |
|
|
1965 |
||||
|
1965 Dec 21-Jan 5 |
19 |
48 |
33 |
|
|
1965 Oct 8-13 |
18 |
46 |
36 |
|
|
1965 May 13-18 |
18 |
52 |
30 |
|
|
1965 Feb 19-24 |
16 |
51 |
33 |
|
|
1964 |
||||
|
1964 Oct 8-13 |
21 |
53 |
26 |
|
|
1964 Sep 18-23 |
19 |
52 |
29 |
|
|
1964 Aug 27-Sep 1 |
18 |
59 |
23 |
|
|
1964 Aug 6-11 |
21 |
54 |
25 |
|
|
1964 Jan 30-Feb 5 |
20 |
48 |
32 |
|
|
1963 |
||||
|
1963 Nov 23-26 |
17 |
55 |
28 |
|
|
1963 Apr 4-9 |
24 |
45 |
31 |
|
|
1963 Jan 11-16 |
21 |
49 |
30 |
|
|
1962 |
||||
|
1962 Aug 23-28 |
22 |
45 |
33 |
|
|
1962 May 31-Jun 5 |
25 |
48 |
27 |
|
|
1961 |
||||
|
1961 Dec 7-12 |
19 |
56 |
25 |
|
|
1961 Sep 21-26 |
18 |
55 |
27 |
|
|
1961 May 17-22 |
20 |
55 |
25 |
|
|
1960 |
||||
|
1960 Oct 18-23 |
31 |
46 |
23 |
|
|
1960 Jun 16-21 |
26 |
47 |
27 |
|
|
1960 Feb 4-9 |
29 |
44 |
27 |
|
|
Republican |
Democratic |
NO DIFFERENCE (vol.)/No opinion |
||
|
1958 |
||||
|
1958 Sep 10-15 |
23 |
45 |
32 |
|
|
1958 Aug 20-25 |
23 |
45 |
32 |
|
|
1958 Feb 14-19 |
22 |
47 |
31 |
|
|
1957 |
||||
|
1957 Sep 19-24 |
31 |
42 |
27 |
|
|
1957 May 17-22 |
36 |
38 |
26 |
|
|
1956 |
||||
|
1956 Oct 18-23 |
39 |
39 |
22 |
|
|
1956 Sep 20-25 |
38 |
37 |
25 |
|
|
1956 Sep 9-14 |
34 |
39 |
27 |
|
|
1956 May 10-15 |
36 |
39 |
25 |
|
|
1955 |
||||
|
1955 Dec 8-13 |
37 |
34 |
29 |
|
|
1955 Oct 6-11 |
36 |
38 |
26 |
|
|
1955 Aug 25-30 |
39 |
37 |
24 |
|
|
1952 |
||||
|
1952 Jul 25-30 |
25 |
52 |
23 |
|
|
1952 Jan 20-25 |
31 |
35 |
34 |
|
|
1951 |
||||
|
1951 Oct 14-19 |
31 |
37 |
32 |
|
|
1951 Aug 3-8 |
32 |
36 |
32 |
|
|
(vol.) Volunteered response |
||||
Do you think it is better for the country -- [ROTATED: to have a president who comes from the same political party that controls Congress, (or do you think it is better) to have a president from one political party and Congress controlled by another]?
BASED ON --500-- NATIONAL ADULTS IN FORM A
|
|
|
NO DIFFERENCE (vol.)/No opinion |
|
|
% |
% |
% |
|
|
2002 Sep 5-8 |
44 |
41 |
15 |
|
2002 Apr 5-7 |
43 |
42 |
15 |
|
2001 Sep 7-10 |
43 |
45 |
12 |
|
2000 Oct 6-9 |
48 |
40 |
12 |
|
Extended Trend: Do you think it is better for the country to have a president who comes from the same political party that controls Congress, or do you think it is better to have a president from one political party and Congress controlled by another? |
|||
|
|
|
NO DIFFERENCE (vol.)/No opinion |
|
|
% |
% |
% |
|
|
2002 Apr 5-7 |
41 |
43 |
16 |
|
2001 Sep 7-10 |
42 |
46 |
12 |
|
2000 Oct 6-9 |
45 |
42 |
13 |
|
1998 Apr 17-19 |
40 |
42 |
18 |
|
1997 Sep 25-28 |
31 |
45 |
24 |
|
1997 Aug 22-25 |
42 |
41 |
17 |
|
1994 Oct 7-9 |
45 |
37 |
18 |
|
1994 Jan 15-17 |
46 |
36 |
18 |
|
1993 Aug 8-10 |
48 |
37 |
15 |
|
CBS/NYT Trend: |
|||
|
1992 Sep |
47 |
31 |
22 |
|
1989 Sep |
35 |
45 |
20 |
|
(vol.) Volunteered response |
|||
Do you think it is better for the country -- [ROTATED: to have a president who comes from the same political party that controls Congress, does it make no difference either way, or do you think it is better to have a president from one political party and Congress controlled by another]?
BASED ON --504-- NATIONAL ADULTS IN FORM B
|
Same party |
No difference |
Different parties |
No opinion |
|
|
2002 Sep 5-8 |
34% |
33 |
30 |
3 |
If the elections for Congress were being held today, which party's candidate would you vote for in your congressional district -- [ROTATE: 1) The Democratic Party's candidate or 2) The Republican Party's candidate]?
As of today, do you lean more toward -- [ROTATE: 1) The Democratic Party's candidate or 2) The Republican Party's candidate]?
|
|
Democratic |
Republican |
UNDECIDED/ |
|
% |
% |
% |
|
|
National Adults |
|||
|
2002 Sep 2-4 |
45 |
40 |
15 |
|
2002 Aug 19-21 |
49 |
41 |
10 |
|
2002 Jul 26-28 |
47 |
40 |
13 |
|
2002 Jun 28-30 |
44 |
46 |
10 |
|
2002 Jun 21-23 |
48 |
40 |
12 |
|
2002 May 28-29 |
44 |
45 |
11 |
|
2002 Apr 29-May 1 |
47 |
43 |
10 |
|
2002 Apr 5-7 |
50 |
40 |
10 |
|
2002 Mar 22-24 |
45 |
43 |
12 |
|
2002 Feb 8-10 |
42 |
44 |
14 |
|
2002 Jan 25-27 |
45 |
44 |
11 |
|
2002 Jan 11-14 |
44 |
44 |
12 |
|
2001 Dec 14-16 |
44 |
46 |
10 |
|
2001 Nov 2-4 |
43 |
44 |
13 |
|
2001 Jun 8-10 |
50 |
43 |
7 |
|
Registered Voters |
|||
|
2002 Sep 2-4 |
46 |
43 |
11 |
|
2002 Aug 19-21 |
50 |
42 |
8 |
|
2002 Jul 26-28 |
48 |
42 |
10 |
|
2002 Jun 28-30 |
44 |
49 |
7 |
|
2002 Jun 21-23 |
50 |
42 |
8 |
|
2002 May 28-29 |
45 |
46 |
9 |
|
2002 Apr 29-May 1 |
48 |
44 |
8 |
|
2002 Apr 5-7 |
50 |
43 |
7 |
|
2002 Mar 22-24 |
46 |
46 |
8 |
|
2002 Feb 8-10 |
43 |
47 |
10 |
|
2002 Jan 25-27 |
44 |
46 |
10 |
|
2002 Jan 11-14 |
43 |
46 |
11 |
|
2001 Dec 14-16 |
43 |
48 |
9 |
|
2001 Nov 2-4 |
45 |
45 |
10 |
|
2001 Jun 8-10 |
49 |
45 |
6 |
