GALLUP NEWS SERVICE
PRINCETON, NJ -- If one accepts the assumption that the American public must reach extreme dissatisfaction with something before it demands government action, then it appears the United States is still a long way from seeing a populist healthcare-reform movement arise.
There are two forces working against a popular revolt on healthcare:
- First, Americans' view of the healthcare situation nationally is negative, but not extremely negative. For instance, according to Gallup's latest survey on health and healthcare in America, conducted Nov. 11-14, only about one in four Americans characterize the nation's healthcare coverage situation as "poor."
- Secondly, this is a classic case of Americans having a much worse view of the national situation than of how the issue plays out in their own lives. Gallup sees the same pattern on education, crime, and the economy: the public believes its local schools are good, its streets are safe, and its jobs are secure, but that nationally, education, crime, and the economy are serious problems.
The Census Bureau set off alarm bells earlier this fall when it released the finding that the number of Americans without health insurance rose again in 2001, after 2 years of decline. Census estimates put the number of uninsured Americans at roughly 41 million, or 14.6% of the entire population. This is up slightly from the 14.2% found to be uninsured the year before. The finding seemed to refuel discussion that healthcare reform is a simmering political issue waiting to be addressed. But Gallup's recent trends on Americans' access to healthcare and their attitudes toward the system suggest otherwise.
National Assessments
Americans' view of the healthcare system nationally is a mix of tepid criticism about the delivery system and its associated costs, but generally positive sentiments about the quality of medical care.
Roughly two-thirds of adults give the nation's healthcare system less-than-positive ratings overall. A combined 68% of Americans rate healthcare coverage in the country as "only fair" (41%) or "poor" (27%). Just 30% consider it "excellent" (4%) or "good" (26%). Similarly, 65% believe the healthcare system nationally has either major problems (54%) or is in a state of crisis (11%). Only a third think the problems are only minor (32%) or don't exist (2%). Perhaps as a result, 62% tell Gallup they believe the federal government is responsible to make sure all Americans have healthcare coverage.
Negative perceptions about the cost of healthcare nationally are even more widespread: 75% of Americans tell Gallup they are dissatisfied with the cost, while just 22% are satisfied. These ratings are slightly worse than last year, when 28% were satisfied with costs.
By contrast with these mostly negative assessments, 55% of the public considers the quality of healthcare in the country to be excellent (14%) or good (41%). Just 12% say it is poor while about one-third (32%) rate it as only fair.
Americans' Personal Healthcare Ratings
At the same time that the new poll shows general dissatisfaction with the health system nationally, it finds that most Americans do have medical insurance and are quite satisfied with their own personal healthcare costs and coverage.
Eighty-eight percent of the nation's adults tell Gallup they currently have health insurance (this is just slightly higher than the 85% estimated by the Census Bureau in 2001). And 90% of parents of children 18 or younger report that their children are covered by health insurance.
An issue confronting healthcare today that is even broader than insurance coverage is the impact that burgeoning managed-care plans are having on the quality of patient care. (According to Gallup's 2001 health survey, 45% of the public is covered under managed care and 15% have a traditional fee-for-service plan, while one-quarter participate in government programs such as Medicare and Medicaid.) Many healthcare industry observers expect an eventual consumer backlash against managed-care policies that restrict patients' access to doctors, hospitals, and brand-name drugs. But for now, the vast majority of Americans with private health insurance seem highly satisfied with their medical care and health coverage.
While Gallup does not have trends to document long-term changes in Americans' satisfaction with their healthcare experiences, the general picture presented by the current survey appears quite positive.
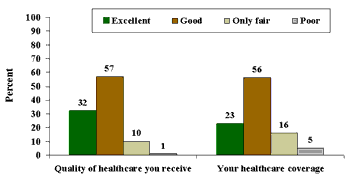
- More than four in five adults with private health insurance rate their quality of care as good or excellent (89%), while only 11% characterize it as only fair or poor.
- These consumers' satisfaction with their healthcare coverage is only slightly less positive: 79% rate it excellent or good vs. 21% only fair/poor.
| Healthcare Ratings Among Adults With Private Insurance |
 |
| Nov. 11-14, 2002 |
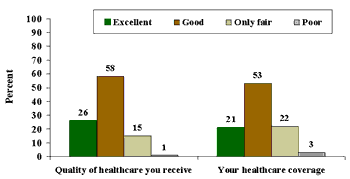
Gallup finds that about one in four Americans receive healthcare coverage through Medicare, Medicaid or California's Medi-Cal insurance program. This includes virtually all Americans aged 65 and older, who are automatically eligible for the federal Medicare program. Satisfaction with healthcare and healthcare coverage is only slightly lower (by about 5 points) among this group than it is among those covered by private insurance plans.
| Healthcare Ratings Among Adults With Medicare/Medicaid |
 |
| Nov. 11-14, 2002 |
Even Costs Not a Major Concern to the Insured
Perhaps the most remarkable finding in the survey is that the percentage of Americans who say they are satisfied with the total amount they pay for healthcare is higher than the percentage who say they are dissatisfied. Overall, 58% of all Americans say they are satisfied with these costs, including 62% of insured Americans. Thirty-nine percent of the general public and 36% of insured Americans are dissatisfied. Satisfaction with costs is almost identical for those covered by private insurance and those covered by Medicare/Medicaid. Not surprisingly, the uninsured are generally dissatisfied with the costs they pay for healthcare, with only 30% satisfied and 60% dissatisfied.
Satisfaction with health costs today is slightly lower than in 2001. Last year at this time, 64% of Americans (compared to 58% today) told Gallup they were satisfied with their costs, while only 33% were dissatisfied. Future Gallup news stories will explore the extent to which this decline is due to the reported shift of healthcare costs from employers to employees in the past several years.
No Rise in Public Concern
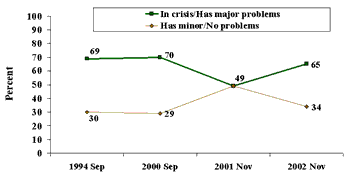
An important finding of the new survey is that Americans are no more concerned about conditions in the healthcare system today than they were amidst the Clinton administration's unsuccessful effort to develop a national healthcare system in 1994.
As noted, Americans' general diagnosis of the nation's healthcare system is not good, according to a question that asks: Which of these statements do you think best describes the U.S. healthcare system today -- it is in a state of crisis, it has major problems, it has minor problems, or it does not have any problems? In answer to this, two-thirds today say it has substantial problems, although most perceive it as having major problems (54%) rather than being in a state of crisis (11%).
But this assessment is largely unchanged from 1994. In fact, the percentage saying the system is in crisis is lower today (11%) than it was at the time the public soured on President Clinton's plan for government-sponsored healthcare (17% in September 1994). Today's results are very similar to what Gallup found in September 2000.
In November 2001, Gallup found a sharp drop in concern about the extent of healthcare problems, but this was most likely an anomaly due to the Sept. 11 attacks 2 months earlier. For at least the first few months after Sept. 11, surveys found the public to be more positive in its ratings of a wide variety of issues, most likely because the attacks made just about everything else seem less worrisome by comparison.
| Condition of U.S. Healthcare System |
 |
Insurance Haves and Have Nots
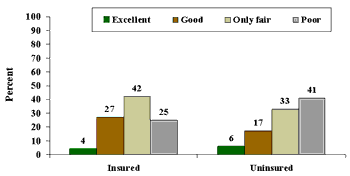
As much as Americans have a negative perception of the healthcare system nationally, the nation's insured majority appears to be far less concerned about the problems than do the uninsured. Only 25% of insured Americans, compared with 41% of the uninsured, call the system "poor."
| Rating U.S. Healthcare Coverage |
 |
| Nov. 11-14, 2002 |
There also clear differences in public attitudes toward the government's role in providing health insurance, depending on one's own health insurance status. While a majority of all groups takes the position that the federal government should guarantee health coverage for all Americans (62%), this viewpoint is much more prevalent among Medicaid/Medicare recipients and the uninsured than it is among those covered by private insurance.
|
Is it the responsibility of the federal government to make sure all Americans have health coverage, or is that not the responsibility of the federal government? |
|||
|
Have private insurance |
Have Medicaid/ |
Not insured |
|
|
% |
% |
% |
|
|
Yes |
57 |
65 |
80 |
|
No |
40 |
31 |
17 |
Thus, as long as most Americans continue to enjoy the benefits of health insurance at an affordable cost, the clarion call for reform may not be sounded.
Survey Methods
These results are based on telephone interviews with a randomly selected national sample of 1,001 adults, 18 years and older, conducted Nov. 11-14, 2002. For results based on this sample, one can say with 95 percent confidence that the maximum error attributable to sampling and other random effects is ±3 percentage points. In addition to sampling error, question wording and practical difficulties in conducting surveys can introduce error or bias into the findings of public opinion polls.
Overall, how would you rate -- [ROTATED] -- as excellent, good, only fair, or poor?
A. The quality of healthcare in this country
|
Excellent |
Good |
Only fair |
Poor |
No opinion |
|
|
% |
% |
% |
% |
% |
|
|
2002 Nov 11-14 |
14 |
41 |
32 |
12 |
1 |
|
2001 Nov 8-11 |
15 |
38 |
34 |
12 |
1 |
B. Healthcare coverage in this country
|
Excellent |
Good |
Only fair |
Poor |
No opinion |
|
|
% |
% |
% |
% |
% |
|
|
2002 Nov 11-14 |
4 |
26 |
41 |
27 |
2 |
|
2001 Nov 8-11 |
5 |
25 |
43 |
26 |
1 |
Are you generally satisfied or dissatisfied with the total cost of healthcare in this country?
|
Satisfied |
Dissatisfied |
No opinion |
||
|
% |
% |
% |
||
|
2002 Nov 11-14 |
22 |
75 |
3 |
|
|
2001 Nov 8-11 |
28 |
71 |
1 |
|
|
1993 May 10-12 ^ |
8 |
90 |
2 |
|
|
^ |
WORDING: Now, thinking about healthcare in the country as a whole, are you generally satisfied, or dissatisfied, with ... Next, … The quality of healthcare in this country. |
|||
Which of these statements do you think best describes the U.S. healthcare system today -- [ROTATED: it is in a state of crisis, it has major problems, it has minor problems, (or) it does not have any problems]?
|
State of |
Major |
Minor |
Does not |
No |
||
|
% |
% |
% |
% |
% |
||
|
2002 Nov 11-14 |
11 |
54 |
32 |
2 |
1 |
|
|
2001 Nov 8-11 |
5 |
44 |
47 |
2 |
2 |
|
|
2000 Sep 11-13 |
12 |
58 |
28 |
1 |
1 |
|
|
1994 Sep 6-7 ^ |
17 |
52 |
29 |
1 |
1 |
|
|
^ |
WORDING: Which of these statements do you think best describes the U.S. healthcare system today -- the healthcare system is in a state of crisis, it has major problems, it has minor problems, or it does not have any problems? |
|||||
Do you think it is the responsibility of the federal government to make sure all Americans have healthcare coverage, or is that not the responsibility of the federal government?
|
Yes, government |
No, not government |
No |
||
|
% |
% |
% |
||
|
2002 Nov 11-14 |
62 |
35 |
3 |
|
|
2001 Nov 8-11 ^ |
62 |
34 |
4 |
|
|
2000 Sep 11-13 |
64 |
31 |
5 |
|
|
2000 Jan 13-16 |
59 |
38 |
3 |
|
|
^ |
Asked of a half sample. |
|||
Next we'd like to ask about your health insurance coverage. Do you currently have medical coverage through Medicare or [Medicaid/Medi-Cal]?
|
Yes |
No |
No opinion |
|
|
% |
% |
% |
|
|
2002 Nov 11-14 |
27 |
72 |
1 |
|
2001 Nov 8-11 |
26 |
73 |
1 |
Do you currently have medical coverage through some other form of health insurance?
BASED ON -- 706 -- ADULTS NOT INSURED BY MEDICARE OR MEDICAID
|
Yes |
No |
No opinion |
|
|
% |
% |
% |
|
|
2002 Nov 11-14 |
83 |
17 |
* |
|
2001 Nov 8-11 |
84 |
16 |
* |
|
* Less than 0.5% |
|||
SUMMARY TABLE: HEALTH INSURANCE COVERAGE (Q.24-25)
|
Private |
Medicare/ |
No |
No |
|
|
% |
% |
% |
% |
|
|
2002 Nov 11-14 |
61 |
27 |
12 |
-- |
|
2001 Nov 8-11 |
62 |
26 |
11 |
1 |
Do you personally have any children age 18 or under?
|
Yes |
No |
No opinion |
|
|
2002 Nov 11-14 |
37% |
63 |
* |
|
* Less than 0.5% |
|||
Do your children, or does your child, currently have medical coverage through some form of health insurance?
BASED ON -- 345 -- PARENTS OF CHILDREN AGE 18 OR YOUNGER
|
Yes |
No |
No opinion |
|
|
2002 Nov 11-14 |
90% |
9 |
1 |
Overall, how would you rate -- [ROTATED] -- as excellent, good, only fair or poor?
A. The quality of healthcare you receive
|
|
|
|
|
NOT |
|
|
|
% |
% |
% |
% |
% |
% |
|
|
2002 Nov 11-14 |
28 |
54 |
14 |
3 |
1 |
* |
|
2001 Nov 8-11 |
31 |
49 |
15 |
3 |
2 |
* |
|
(vol.) Volunteered response |
||||||
|
* Less than 0.5% |
||||||
B. Your healthcare coverage
|
|
|
|
|
NOT |
|
||
|
% |
% |
% |
% |
% |
% |
||
|
2002 Nov 11-14 |
20 |
51 |
17 |
7 |
4 |
1 |
|
|
2001 Nov 8-11 |
22 |
46 |
20 |
6 |
5 |
1 |
|
|
(vol.) Volunteered response |
|||||||
Are you generally satisfied or dissatisfied with the total cost you pay for your healthcare?
|
Satisfied |
Dissatisfied |
No opinion |
|
|
2002 Nov 11-14 |
58% |
39 |
3 |
|
2001 Nov 8-11 |
64% |
33 |
3 |
