GALLUP NEWS SERVICE
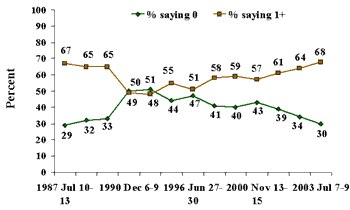
PRINCETON, NJ -- Over the past decade, the overall percentage of Americans who drink alcohol has remained fairly stable, but among those who drink, the reported frequency of drinking and amount of alcohol consumed have risen. Roughly three in five Americans tell Gallup that they occasionally drink alcohol, while the remaining two in five are "total abstainers." Among those who drink, the percentage saying they have had at least one drink in the past week has risen from 48% in 1992 to 68% today. The sharpest increase in reported drinking has come in the past three years.
| Number of Alcoholic Drinks Consumed in Past
Week Based on Drinkers |
 |
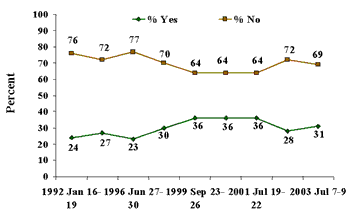
Over the same period, there has not been a similar increase in the percentage of American drinkers admitting that they sometimes drink more than they should -- that figure is 24% today -- or in the percentage of Americans saying drinking has been the cause of problems in their family -- now 31%.
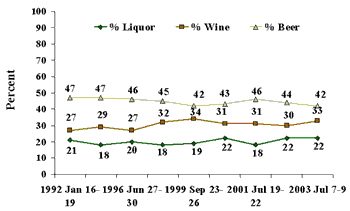
Gallup also does not see a recent shift in Americans' alcoholic beverage choices. Beer remains the drink of choice for more American drinkers than either wine or liquor. Preference for beer is somewhat lower today than in 1992, as wine has gained popularity. However, these preferences stabilized between 1999 and 2000 and have not changed much since.
| Do You Most Often Drink Liquor, Wine, or
Beer? Based on Drinkers |
 |
Big Increase in Light Drinking
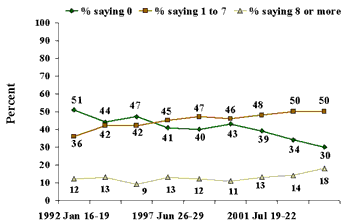
Gallup found a sharp decline since 1992 in the percentage of adult drinkers (defined as those who say that they are not total abstainers) having no drinks in the past week -- mostly offset by an increase in those having between one and seven drinks in the week. The percentage of drinkers consuming this relatively light amount rose from 36% to 50%. The percentage having eight or more drinks rose from 12% to 18%.
| Number of Alcoholic Drinks Consumed in Past
Week Based on Drinkers |
 |
Most Americans Drinking "Moderately"
News reports in recent years have highlighted the controversial finding that moderate drinking is associated with lower incidence of heart problems. Many medical experts are reluctant to recommend that a person begin consuming alcohol (because of the significant problems associated with problem-drinking and alcoholism), but a common medical recommendation for moderate drinking is one drink per day for non-pregnant women and two drinks per day for men. This translates into as many as 7 drinks per week for women and 14 drinks per week for men.
Few Americans report drinking more than this amount, and the vast majority of drinkers say they had either no drinks in the past week, or only 1 to 7 drinks. The following table breaks this out by gender, showing that, according to the reported number of drinks consumed in the past week, the majority of men and women are within the accepted range of moderate drinking for their gender.
Nearly 9 in 10 men (87%) had consumed no more than 14 drinks in the past week. Only 12% of men admitted to drinking more than this. The figures are similar for women, with 89% of women falling within the range of acceptable drinking, saying they had no more than seven drinks in the past week. Another 10% drank more than that.
|
Average Number of Drinks in Past Week Based on Drinkers
|
||
|
Men |
Women |
|
|
% |
% |
|
|
Zero drinks in past week |
25 |
36 |
|
Avg. up to 1 drink per week (1 to 7 drinks) |
47 |
53 |
|
Avg. up to 2 drinks per day (8 to 14 drinks) |
15 |
7 |
|
Avg. up to 3 drinks per day (9 to 21 drinks) |
4 |
2 |
|
Avg. more than 3 drinks per day (22+ drinks) |
8 |
1 |
|
No opinion |
1 |
1 |
|
Total |
100% |
100% |
Because drinking may be concentrated on certain days rather than evenly distributed throughout the week, the previous figures don't tell the full story. A Gallup question asking drinkers if they ever drink more than they think they should clarifies the extent of problem-drinking in America, and finds that nearly a quarter of drinkers occasionally overdo it. The rate of overindulgence is slightly higher for men (27%) than for women (20%).
(It is important to note that retrospective self-reports of weekly behavior are estimates on the part of the respondent, and it is not unreasonable to hypothesize that heavy drinkers might minimize their estimates of alcohol consumed in response to these types of questions.)
No Clear Change in Negative Effects of Drinking
Gallup trends on alcohol-related issues reveal some shifts in the rate of reported problems associated with drinking, but these changes are not entirely consistent with the generally gradual increase in drinking seen over the past decade.
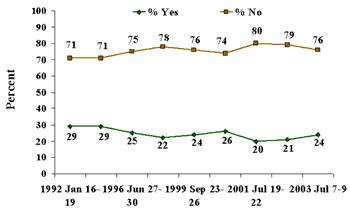
Since 1992, the percentage of Americans saying they sometimes drink more alcohol than they should has declined somewhat, from 29% to 24% today -- running counterintuitive to the apparent increase in drinking. However, rather than declining gradually, the percentage reporting that they sometimes drink too much has bounced around between 20% and 29%.
| Do You Sometimes Drink More Alcoholic
Beverages Than You Think You Should? Based on Drinkers |
 |
Similarly, the percentage of all Americans reporting that drinking has been a cause of trouble in their family has varied between 23% and 36% since 1992, with no clear direction in the movement.
| Has Drinking Ever Been a Cause of Trouble in Your Family? |
 |
Few Americans Consider Alcohol Beneficial to Health
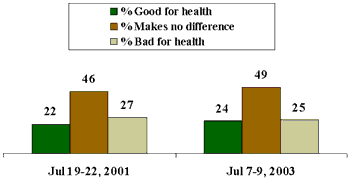
Despite studies in recent years pointing to some health benefits associated with moderate drinking, the message about alcohol's potential health benefits does not seem to have reached the public. Americans are as likely to believe that moderate drinking is bad for one's health (25%) as believe it is good for one's health (24%), while the largest segment believes it makes no difference (49%).
| Do you, personally, think drinking in moderation -- that is, one or two drinks a day -- is good for your health, makes no difference, or is bad for your health? |
 |
Survey Methods
These results are based on telephone interviews with a randomly selected national sample of 1,006 adults, aged 18 and older, conducted July 7-9, 2003. For results based on this sample, one can say with 95% confidence that the maximum error attributable to sampling and other random effects is ±3 percentage points. In addition to sampling error, question wording and practical difficulties in conducting surveys can introduce error or bias into the findings of public opinion polls.
28. Do you have occasion to use alcoholic beverages such as liquor, wine or beer, or are you a total abstainer?
|
Yes, |
No, total abstainer |
Yes, |
No, total abstainer |
|||
|
% |
% |
% |
% |
|||
|
2003 Jul 7-9 |
62 |
38 |
1979 May 4-7 |
69 |
31 |
|
|
1978 Nov 10-13 |
66 |
34 |
||||
|
2002 Jul 9-11 |
66 |
34 |
1978 Apr 21-24 |
71 |
29 |
|
|
2001 Jul 19-22 |
62 |
38 |
1977 Jan 14-17 |
71 |
29 |
|
|
2000 Nov 13-15 |
64 |
36 |
1976 |
71 |
29 |
|
|
1999 Sep 23-26 |
64 |
36 |
1974 May 10-13 |
68 |
32 |
|
|
1997 Jun 26-29 |
61 |
39 |
1969 Jan 1-6 |
64 |
36 |
|
|
1996 Jun 27-30 |
58 |
42 |
1969 Feb 22-27 |
63 |
37 |
|
|
1994 Jun 3-6 |
65 |
35 |
1966 Jan 21-26 |
65 |
35 |
|
|
1992 Jan 16-19 |
64 |
35 |
1964 |
63 |
37 |
|
|
1990 Dec 6-9 |
57 |
43 |
1960 Mar 30-Apr 4 |
62 |
38 |
|
|
1989 Sep 12-15 |
56 |
44 |
1959 Dec 10-15 |
61 |
39 |
|
|
1989 Apr 4-9 |
62 |
38 |
1958 Jan 24-29 |
55 |
45 |
|
|
1988 Jul 1-7 |
63 |
37 |
1957 Mar 15-20 |
58 |
42 |
|
|
1988 Mar 8-12 |
62 |
38 |
1956 Jan 6-11 |
60 |
40 |
|
|
1987 Jul 10-13 |
65 |
35 |
1952 Dec 11-16 |
60 |
40 |
|
|
1987 Apr 10-13 |
63 |
37 |
1951 Aug 26-31 |
59 |
41 |
|
|
1987 Mar 14-18 |
65 |
35 |
1950 Jun 4-9 |
60 |
40 |
|
|
1985 Feb 15-18 |
67 |
33 |
1949 Dec 1-6 |
58 |
42 |
|
|
1984 Sep 6-9 |
64 |
36 |
1947 Oct 3-8 |
63 |
37 |
|
|
1984 Jul 6-9 |
64 |
36 |
1946 Jul 26-31 |
67 |
33 |
|
|
1983 Mar 11-14 |
65 |
35 |
1945 Nov 23-28 |
67 |
33 |
|
|
1982 Aug 13-16 |
65 |
35 |
1939 |
58 |
42 |
|
|
1981 Jan 9-12 |
70 |
30 |
29. When did you last take a drink of any kind of alcoholic beverage?
BASED ON –656—WHO DRINK ALCOHOLIC BEVERAGES
|
|
Over 1 day |
Over 1 |
|
|
|
% |
% |
% |
% |
|
|
2003 Jul 7-9 |
31 |
40 |
29 |
* |
|
2002 Jul 9-11 |
28 |
38 |
34 |
* |
|
2001 Jul 19-22 |
30 |
32 |
38 |
* |
|
200 Nov 13-15 |
26 |
32 |
42 |
* |
|
1999 Sep 23-26 |
35 |
25 |
39 |
1 |
|
1997 Jun 26-29 |
33 |
25 |
42 |
* |
|
1996 Jun 27-30 |
28 |
26 |
45 |
1 |
|
1994 Jun 3-6 |
34 |
23 |
42 |
1 |
|
1992 Jan 16-19 |
26 |
24 |
49 |
1 |
|
1990 Dec 6-9 |
29 |
23 |
47 |
1 |
|
1989 Sep 12-15 |
32 |
35 |
32 |
1 |
|
1988 Jul 1-7 |
39 |
25 |
34 |
2 |
|
1987 Jul 10-13 |
38 |
30 |
31 |
1 |
|
1984 Jul 6-9 |
39 |
29 |
31 |
1 |
30. (If drank within past week) Approximately how many drinks of any kind of alcoholic beverages did you drink in the past seven days?
BASED ON –656—WHO DRINK ALCOHOLIC BEVERAGES
|
|
|
|
|
Don't know |
|
|
|
|
% |
% |
% |
% |
% |
% |
% |
|
|
2003 Jul 7-9 |
30 |
50 |
12 |
6 |
2 |
5.1 |
2 |
|
2002 Jul 9-11 |
34 |
50 |
9 |
5 |
2 |
4.4 |
2 |
|
2001 Jul 19-22 |
39 |
48 |
9 |
4 |
* |
3.4 |
1 |
|
2000 Nov 13-15 |
43 |
46 |
8 |
3 |
* |
3.3 |
1 |
|
1999 Sep 23-26 |
40 |
47 |
8 |
4 |
* |
3.7 |
2 |
|
1997 Jun 26-29 |
41 |
45 |
8 |
5 |
1 |
3.6 |
1 |
|
1996 Jun 27-30 |
47 |
42 |
7 |
2 |
2 |
2.8 |
1 |
|
1994 Jun 3-6 |
44 |
42 |
10 |
3 |
1 |
-- |
-- |
|
1992 Jan 16-19 |
51 |
36 |
10 |
2 |
1 |
-- |
-- |
|
1990 Dec 6-9 |
50 |
40 |
6 |
3 |
1 |
-- |
-- |
|
1989 Sep 12-15 |
33 |
47 |
13 |
5 |
2 |
-- |
-- |
|
1988 Jul 1-7 |
32 |
49 |
10 |
6 |
3 |
-- |
-- |
|
1987 Jul 10-13 |
29 |
50 |
11 |
6 |
4 |
-- |
-- |
31. Do you most often drink liquor, wine, or beer?
BASED ON –656—WHO DRINK ALCOHOLIC BEVERAGES
|
|
|
|
ALL/ |
OTHER |
No |
|
|
% |
% |
% |
% |
% |
% |
|
|
2003 Jul 7-9 |
22 |
33 |
42 |
3 |
* |
* |
|
2002 Jul 9-11 |
22 |
30 |
44 |
3 |
1 |
* |
|
2001 Jul 19-22 |
18 |
31 |
46 |
4 |
* |
1 |
|
2000 Nov 13-15 |
22 |
31 |
43 |
3 |
0 |
1 |
|
1999 Sep 23-26 |
19 |
34 |
42 |
4 |
* |
1 |
|
1997 Jun 26-29 |
18 |
32 |
45 |
4 |
* |
1 |
|
1996 Jul 25-28 |
20 |
27 |
46 |
6 |
0 |
1 |
|
1994 Jun 3-6 |
18 |
29 |
47 |
3 |
1 |
2 |
|
1992 Jan 16-19 |
21 |
27 |
47 |
3 |
1 |
1 |
32. Do you sometimes drink more alcoholic beverages than you think you should?
BASED ON –656—WHO DRINK ALCOHOLIC BEVERAGES
|
Yes |
No |
No opinion |
|
|
% |
% |
% |
|
|
2003 Jul 7-9 |
24 |
76 |
* |
|
2002 Jul 9-11 |
21 |
79 |
* |
|
2001 Jul 19-22 |
20 |
80 |
* |
|
2000 Nov 13-15 |
26 |
74 |
* |
|
1999 Sep 23-26 |
24 |
76 |
* |
|
1997 Jun 26-29 |
22 |
78 |
* |
|
1996 Jul 25-28 |
25 |
75 |
* |
|
1994 Jun 3-6 |
29 |
71 |
0 |
|
1992 Jan 16-19 |
29 |
71 |
-- |
|
1990 Dec 6-9 |
23 |
76 |
1 |
|
1989 Sep 12-15 |
35 |
65 |
-- |
|
1987 Jul 1-7 |
29 |
71 |
-- |
|
1985 Feb 15-18 |
32 |
68 |
-- |
|
1978 Nov 10-13 |
23 |
77 |
-- |
33. Has drinking ever been a cause of trouble in your family?
|
Yes |
No |
No answer |
|
|
% |
% |
% |
|
|
2003 Jul 7-9 |
31 |
69 |
* |
|
2002 Jul 9-11 |
28 |
72 |
* |
|
2001 Jul 19-22 |
36 |
64 |
* |
|
2000 Nov 13-15 |
36 |
64 |
* |
|
1999 Sep 23-26 |
36 |
64 |
* |
|
1997 Jun 26-29 |
30 |
70 |
* |
|
1996 Jun 27-30 |
23 |
77 |
* |
|
1994 Jun 3-6 |
27 |
72 |
1 |
|
1992 Jan 16-19 |
24 |
76 |
-- |
|
1990 Dec 6-9 |
23 |
76 |
1 |
|
1989 Sep 12-15 |
19 |
81 |
-- |
|
1987 Mar 14-18 |
24 |
76 |
-- |
|
1985 Feb 15-18 |
21 |
79 |
-- |
|
1984 Jul 6-9 |
18 |
82 |
-- |
|
1981 |
22 |
78 |
-- |
|
1978 |
22 |
78 |
-- |
|
1976 |
17 |
83 |
-- |
|
1974 |
12 |
88 |
-- |
|
1966 |
12 |
88 |
-- |
|
1947 |
15 |
85 |
-- |
34. Do you, personally, think drinking in moderation -- that is, one or two drinks a day -- [ROTATED: is good for your health, makes no difference, or is bad for your health]?
|
Good for |
Makes no difference |
Bad for |
No |
|
|
2003 Jul 7-9 |
24% |
49 |
25 |
2 |
|
2001 Jul 19-22 |
22% |
46 |
27 |
5 |
