GALLUP NEWS SERVICE
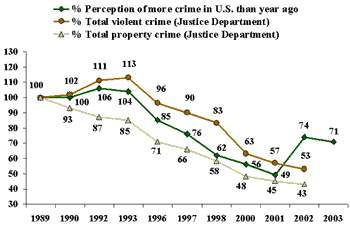
PRINCETON, NJ -- For the second consecutive year, public perceptions of the national crime problem appear to be out of line with government statistics showing violent crimes as well as property crimes reaching record lows in the United States, following long-term declines in each. Today, as in 2002, a majority of Americans believe there is more crime in the United States than there was a year ago.
According to the U.S. Department of Justice, serious crime in the United States began to fall in the mid-1990s and has continued downward ever since. In 1993, the rate of violent crime was 49 cases per 1,000 persons aged 12 and older; the rate of property crime, which includes burglary and car theft (the property-crime rate has been falling since the mid-1970s), was 319 cases per 1,000 households. In 2002 these figures were 23 and 159, respectively.
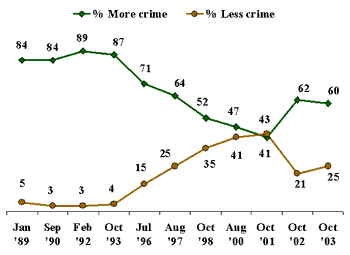
Just a few years ago, Americans did start to take notice of this good news. The percentage of Americans holding negative views of the crime rate -- saying there is more crime in the country than there was a year ago -- fell from 89% in 1992 to 71% by 1996 and to 47% in 2000. The public's most positive assessment on this measure was reached in October 2001, just one month after the Sept. 11 terrorist attacks, when only 41% believed there was more crime in the United States and 43% said there was less crime than the year before. But last year, this changed sharply -- most likely due to the Washington, D.C.-area sniper shootings that were still occurring at the time of the poll. The perception that crime was worse jumped to 62%. Today it remains at roughly the same level, with 60% saying crime is worse now than a year ago.
| Is There More Crime or Less Crime in the United States Today? |
 |
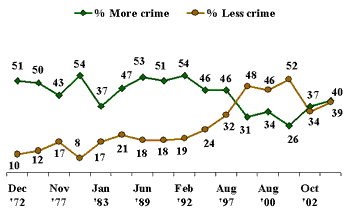
Public perceptions about the local crime rate follow the same pattern, although Americans tend to be more positive about local crime than they are about crime nationally: today, only 40% believe crime is up in their area, versus 60% who say this about the country as a whole. However, just two years ago, only 26% believed crime was up in their area. So this perception, too, has worsened in the last two years.
| Is There More Crime or Less Crime in Your Area Today? |
 |
Last year, the Washington, D.C.-area sniper shootings provided a plausible explanation for why Americans may have had a heightened sense of the U.S. crime problem. This year, it is less clear why that higher level of concern would be maintained. Gallup's October 2003 crime poll was conducted just over one month after the Justice Department released its 2002 crime data under the headline: "Violent Crime and Property Crime Levels Fall to the Lowest Levels Since 1973." So to the extent that public perceptions of the crime problem are based on media reports of such statistics, it seems the positive message is not getting through to the public as effectively as it did in previous years.
| Actual vs. Perceived Rate of Crime Data normalized to 100% at 1989 Level |
 |
Personal Fear Levels Remain Steady
Americans' personal fear of crime has shown little change over this period, so there is no evidence that their heightened sense of the crime problem is due to personal feelings of insecurity. For the past few years, Gallup has annually tracked Americans' fears of being the victim of a variety of crimes. The trends show no significant change for any of the conventional types of crime. However, fear of being a victim of terrorism has declined since October 2001. Today, just 38% of Americans say they worry frequently or occasionally about this, compared with 47% in the immediate aftermath of the Sept. 11 attacks.
Despite this decline, being a terrorist victim ranks fairly high on the list of Americans' concerns about their personal exposure to crime. Fear of terrorism is about as common as fear that one's school-aged child will be physically harmed while at school. But Americans are more likely to worry about being a victim of terrorism than they are to worry about being murdered, mugged, sexually assaulted, carjacked, or otherwise attacked. The most common concerns, however, involve crimes against property, including having "your home … burglarized when you are not there" and "having your car stolen or broken into."
|
Americans' Personal Crime Fears |
|
|
% Worrying Frequently or Occasionally |
|
|
Your home being burglarized when you are not there |
48 |
|
Having your car stolen or broken into |
45 |
|
Being a victim of terrorism |
38 |
|
Having a school-aged child of yours physically harmed while attending school |
35 |
|
Your home being burglarized when you are there |
30 |
|
Getting mugged |
28 |
|
Being attacked while driving your car |
26 |
|
Being sexually assaulted |
23 |
|
Getting murdered |
18 |
|
Being the victim of a hate crime |
17 |
|
Being assaulted/killed by a coworker/employee where you work |
9 |
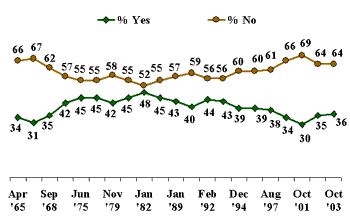
A question with trends dating back to the 1960s asks Americans about their fear of walking alone within a mile of their home at night; 36% of Americans say they are fearful, similar to what has been found since 1997. Only in October 2001 did a significantly lower percentage say they were afraid. Longer term, fear on this measure is somewhat lower today than it was from the 1970s through 1993.
| Is There an Area Near Where You Live Where You Are Afraid to Walk Alone at Night? |
 |
Women Especially Fearful of Crime
Women are much more likely than men to indicate fear for their safety in their local area: 50% of women say there is an area within a mile of their home where they would be afraid to walk alone at night, compared to only 19% of men.
Not surprisingly, 52% of residents of urban areas express this concern, compared with smaller percentages of those living in either suburban (31%) or rural areas (26%).
Outside of a somewhat higher percentage indicating fear among those aged 65 and older, relatively minor differences in fear are seen among people of various age groups. However, there are substantial differences by household income. Only 24% of those earning high incomes (those making $75,000 or more) say they would be fearful in walking alone at night near their home, compared with 45% of those in the lowest income bracket (those earning less than $20,000). This is consistent with crime statistics showing that the poor are much more likely to be the victims of crime, particularly violent crime.
In addition to being more fearful about walking alone at night near their home, women are significantly more likely than men to say that they frequently or occasionally worry about a number of specific crimes. Sexual assault is naturally a much higher concern for women than for men, but women are also moderately more likely to fear being mugged, becoming a terrorist victim and having their home burglarized.
|
% Worrying Frequently/Occasionally About Crimes
|
|||
|
Women |
Men |
Difference (in pct. pts.) |
|
|
% |
% |
||
|
Sexually assaulted |
39 |
5 |
34 |
|
Being mugged |
34 |
21 |
13 |
|
Being a terrorist victim |
44 |
31 |
13 |
|
Home burglarized when there |
35 |
23 |
12 |
|
Home burglarized when not there |
52 |
42 |
10 |
|
Attacked while driving car |
30 |
22 |
8 |
|
Child harmed at school |
38 |
31 |
7 |
|
Being murdered |
21 |
15 |
6 |
|
Car stolen or broken into |
47 |
43 |
4 |
|
Victimized by hate crime |
18 |
14 |
4 |
|
Assaulted or killed by coworker |
9 |
9 |
0 |
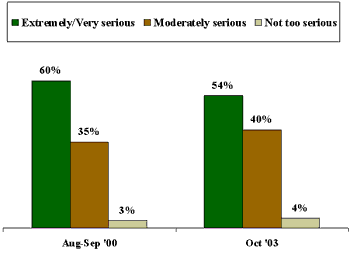
One curious finding in the new poll is that despite being more likely today than in 2000 to believe crime is getting worse, Americans are now less likely to describe the nation's crime problem as serious. About half the public, 54%, today says that crime in the United States is an extremely or a very serious problem; this figure was 60% in 2000.
| Perception of Crime Problem in United States |
 |
Survey Methods
These results are based on telephone interviews with a randomly selected national sample of 1,017 adults, 18 years and older, conducted Oct. 6-8, 2003. For results based on this sample, one can say with 95% confidence that the maximum error attributable to sampling and other random effects is ±3 percentage points. In addition to sampling error, question wording and practical difficulties in conducting surveys can introduce error or bias into the findings of public opinion polls.
13. Is there more crime in the U.S. than there was a year ago, or less?
|
More |
Less |
SAME (vol.) |
No opinion |
|
|
% |
% |
% |
% |
|
|
2003 Oct 6-8 |
60 |
25 |
11 |
4 |
|
2002 Oct 14-17 |
62 |
21 |
11 |
6 |
|
2001 Oct 11-14 |
41 |
43 |
10 |
6 |
|
2000 Aug 29-Sep 5 |
47 |
41 |
7 |
5 |
|
1998 Oct 23-25 |
52 |
35 |
8 |
5 |
|
1997 Aug 22-25 |
64 |
25 |
6 |
5 |
|
1996 Jul 25-28 |
71 |
15 |
8 |
6 |
|
1993 Oct 13-18 |
87 |
4 |
5 |
4 |
|
1992 Feb 28-Mar 1 |
89 |
3 |
4 |
4 |
|
1990 Sep 10 |
84 |
3 |
7 |
6 |
|
1989 Jan 24-28 |
84 |
5 |
5 |
6 |
|
(vol.) Volunteered response |
||||
14. Is there any area near where you live -- that is, within a mile -- where you would be afraid to walk alone at night?
|
Yes |
No |
No opinion |
|
|
% |
% |
% |
|
|
2003 Oct 6-8 |
36 |
64 |
* |
|
2002 Oct 14-17 |
35 |
64 |
1 |
|
2001 Oct 11-14 |
30 |
69 |
1 |
|
2000 Aug 29-Sep 5 |
34 |
66 |
* |
|
1997 Aug 22-25 |
38 |
61 |
1 |
|
1996 Jul 25-28 |
39 |
60 |
1 |
|
1994 Dec 19-26 |
39 |
60 |
-- |
|
1993 Oct 13-18 |
43 |
56 |
1 |
|
1992 Feb 28-Mar 1 |
44 |
56 |
-- |
|
1990 Sep 10-11 |
40 |
59 |
-- |
|
1989 Jan 24-28 |
43 |
57 |
-- |
|
1983 Jan 28-31 |
45 |
55 |
* |
|
1982 Jan 22-25 |
48 |
52 |
* |
|
1981 Jan 9-12 |
45 |
55 |
-- |
|
1979 Nov 2-5 |
42 |
58 |
-- |
|
1977 Nov 18-21 |
45 |
55 |
-- |
|
1975 Jun 27-30 |
45 |
55 |
-- |
|
1972 Dec 8-11 |
42 |
57 |
1 |
|
1968 Sep 19-24 |
35 |
62 |
3 |
|
1967 Aug 3-8 |
31 |
67 |
3 |
|
1965 Apr 2-7 |
34 |
66 |
-- |
|
* Less than 0.5% |
|||
15. Overall, how would you describe the problem of crime [ROTATED: in the United States/in the area where you live] -- is it extremely serious, very serious, moderately serious, not too serious, or not serious at all? How would you describe the problem of crime … extremely serious, very serious, moderately serious, not too serious, or not serious at all?
A. In the United States
|
|
|
|
|
Not serious |
|
|
|
2003 Oct 6-8 |
17% |
37 |
40 |
4 |
1 |
1 |
|
2000 Aug 29-Sep 5 |
22% |
38 |
35 |
3 |
1 |
1 |
B. In the area where you live
|
|
|
|
|
Not serious |
|
|
|
2003 Oct 6-8 |
4% |
7 |
33 |
35 |
21 |
* |
|
2000 Aug 29-Sep 5 |
3% |
9 |
35 |
35 |
18 |
* |
|
* Less than 0.5% |
||||||
20. How often do you, yourself, worry about the following things -- frequently, occasionally, rarely or never? How about -- [ITEMS A-H ROTATED, THEN ITEM I]?
A. Getting murdered
|
|
|
|
|
DOESN'T APPLY (vol.) |
|
|
|
% |
% |
% |
% |
% |
% |
|
|
2003 Oct 6-8 |
6 |
12 |
30 |
52 |
* |
-- |
|
2002 Oct 14-17 |
6 |
11 |
30 |
53 |
* |
* |
|
2001 Oct 11-14 |
4 |
9 |
31 |
56 |
* |
* |
|
2000 Aug 29-Sep 5 |
6 |
12 |
31 |
51 |
* |
* |
B. Getting mugged
|
|
|
|
|
DOESN'T APPLY (vol.) |
|
|
|
2003 Oct 6-8 |
9 |
19 |
35 |
37 |
* |
-- |
|
2002 Oct 14-17 |
8 |
18 |
33 |
40 |
* |
1 |
|
2001 Oct 11-14 |
6 |
17 |
36 |
41 |
* |
* |
|
2000 Aug 29-Sep 5 |
9 |
21 |
33 |
36 |
1 |
* |
C. Your home being burglarized when you are not there
|
|
|
|
|
DOESN'T APPLY (vol.) |
|
|
|
% |
% |
% |
% |
% |
% |
|
|
2003 Oct 6-8 |
17 |
31 |
31 |
21 |
-- |
* |
|
2002 Oct 14-17 |
15 |
30 |
30 |
25 |
* |
* |
|
2001 Oct 11-14 |
12 |
28 |
33 |
26 |
* |
1 |
|
2000 Aug 29-Sep 5 |
16 |
32 |
28 |
24 |
0 |
* |
D. Your home being burglarized when you are there
|
|
|
|
|
DOESN'T APPLY (vol.) |
|
|
|
% |
% |
% |
% |
% |
% |
|
|
2003 Oct 6-8 |
10 |
20 |
30 |
40 |
* |
* |
|
2002 Oct 14-17 |
9 |
18 |
32 |
40 |
1 |
* |
|
2001 Oct 11-14 |
6 |
16 |
33 |
45 |
* |
* |
|
2000 Aug 29-Sep 5 |
10 |
21 |
30 |
39 |
* |
0 |
E. Being sexually assaulted
|
|
|
|
|
DOESN'T APPLY (vol.) |
|
|
|
% |
% |
% |
% |
% |
% |
|
|
2003 Oct 6-8 |
9 |
14 |
27 |
50 |
* |
* |
|
2002 Oct 14-17 |
6 |
12 |
26 |
55 |
1 |
0 |
|
2001 Oct 11-14 |
4 |
15 |
24 |
57 |
* |
* |
|
2000 Aug 29-Sep 5 ^ |
7 |
16 |
24 |
52 |
1 |
* |
|
^ WORDING: Being raped or sexually assaulted |
||||||
F. Having your car stolen or broken into
|
|
|
|
|
DOESN'T APPLY (vol.) |
|
|
|
% |
% |
% |
% |
% |
% |
|
|
2003 Oct 6-8 |
17 |
28 |
31 |
22 |
2 |
* |
|
2002 Oct 14-17 |
16 |
28 |
28 |
24 |
4 |
* |
|
2001 Oct 11-14 |
14 |
27 |
30 |
26 |
3 |
* |
|
2000 Aug 29-Sep 5 |
16 |
32 |
26 |
24 |
2 |
* |
G. Being assaulted or killed by a co-worker or other employee where you work
|
|
|
|
|
DOESN'T APPLY (vol.) |
|
|
|
% |
% |
% |
% |
% |
% |
|
|
2003 Oct 6-8 |
3 |
6 |
20 |
56 |
15 |
* |
|
2002 Oct 14-17 |
2 |
4 |
18 |
61 |
14 |
1 |
|
2001 Oct 11-14 |
2 |
5 |
18 |
62 |
13 |
* |
|
2000 Aug 29-Sep 5 |
1 |
6 |
18 |
62 |
12 |
1 |
H. Having a school-aged child of yours physically harmed while attending school
|
|
|
|
|
DOESN'T APPLY (vol.) |
|
|
|
% |
% |
% |
% |
% |
% |
|
|
2003 Oct 6-8 |
17 |
18 |
16 |
23 |
25 |
1 |
|
2002 Oct 14-17 |
14 |
15 |
21 |
20 |
30 |
* |
|
2001 Oct 11-14 |
13 |
18 |
18 |
23 |
28 |
* |
|
2000 Aug 29-Sep 5 |
17 |
17 |
17 |
22 |
27 |
* |
I. Being attacked while driving your car
|
|
|
|
|
DOESN'T APPLY (vol.) |
|
|
|
% |
% |
% |
% |
% |
% |
|
|
2003 Oct 6-8 |
8 |
18 |
32 |
38 |
4 |
* |
|
2001 Oct 11-14 |
6 |
15 |
29 |
46 |
4 |
* |
|
2000 Aug 29-Sep 5 |
9 |
20 |
29 |
40 |
2 |
* |
J. Being the victim of a hate crime
|
|
|
|
|
DOESN'T APPLY (vol.) |
|
|
|
% |
% |
% |
% |
% |
% |
|
|
2003 Oct 6-8 |
5 |
12 |
29 |
54 |
* |
-- |
|
2001 Oct 11-14 |
5 |
8 |
26 |
60 |
* |
1 |
|
2000 Aug 29-Sep 5 |
6 |
10 |
26 |
56 |
1 |
1 |
K. Being a victim of terrorism
|
|
|
|
|
DOESN'T APPLY (vol.) |
|
|
|
% |
% |
% |
% |
% |
% |
|
|
2003 Oct 6-8 |
13 |
25 |
30 |
32 |
-- |
* |
|
2002 Oct 14-17 |
14 |
26 |
28 |
31 |
* |
1 |
|
2001 Oct 11-14 |
21 |
26 |
28 |
25 |
* |
* |
|
(vol.) Volunteered response |
||||||
|
* Less than 0.5% |
||||||
SUMMARY TABLE: FEAR OF CRIME
|
|
|
Oc-casion-ally |
Rarely or never |
DOESN'T APPLY (vol.) |
|
% |
% |
% |
% |
|
|
Your home being burglarized when you are not there |
17 |
31 |
52 |
-- |
|
Having your car stolen or broken into |
17 |
28 |
53 |
2 |
|
Having a school-aged child physically harmed attending school |
17 |
18 |
39 |
25 |
|
Being the victim of terrorism |
13 |
25 |
62 |
-- |
|
Your home being burglarized when you are there |
10 |
20 |
70 |
* |
|
Getting mugged |
9 |
19 |
72 |
* |
|
Being sexually assaulted |
9 |
14 |
77 |
* |
|
Being attacked while driving your car |
8 |
18 |
70 |
4 |
|
Getting murdered |
6 |
12 |
82 |
* |
|
Being a victim of a hate crime |
5 |
12 |
83 |
* |
|
Being assaulted/killed by a co-worker/employee where you work |
3 |
6 |
76 |
15 |
|
(vol.) Volunteered response |
||||
|
* Less than 0.5% |
||||
