WASHINGTON, DC -- Colorado residents were the least likely in the nation to be obese in 2012 -- as has been the case since 2010 -- making it the only state where less than 20% of adults are obese. West Virginia - also for a third year in a row -- is the state with the highest obesity rate, at 33.5%; however, this is down from 35.3% in 2012, which was the highest for any state that Gallup and Healthways have found since 2008.
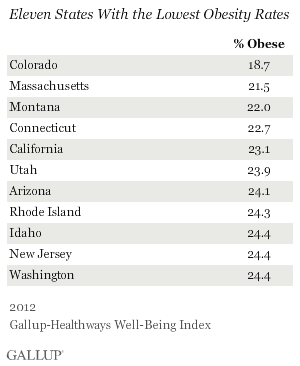
The national obesity rate remained steady at 26.2% in 2012, compared with 26.1% in 2011, but is still higher than the 2008 average of 25.5%. Across states, obesity rates were statistically unchanged in 2012 when compared with 2011, with the exception of four states. Obesity rates increased in New Jersey, Georgia, and North Carolina while obesity rates in Delaware decreased.
These data, collected as part of the Gallup-Healthways Well-Being Index, are based on respondents' self-reports of their height and weight, which are used to calculate Body Mass Index (BMI) scores. Americans who have a BMI of 30 or higher are classified as obese. Gallup and Healthways have been tracking Americans' weight situation daily since January 2008.
Obesity rates continue to be highest in Southern and Midwestern states and lowest in Western and Northeastern states.
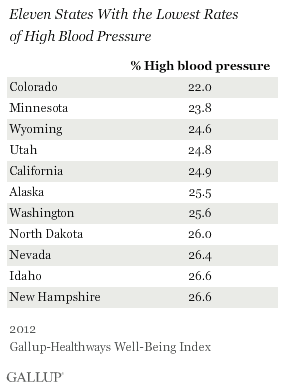
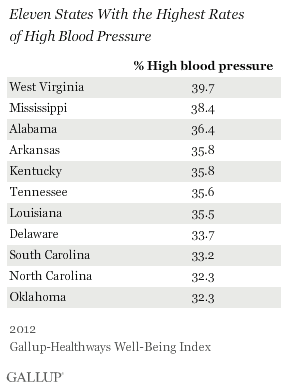
Diabetes and high blood pressure rates follow the same geographic pattern.
High Blood Pressure, Diabetes Rates Also Fairly Steady Across States
An average of 29.3% of American adults said they had ever been diagnosed with high blood pressure in 2012, compared with 30% in 2011, but exactly on par with the 2008 national average. Still, high blood pressure rates across most states remain statistically unchanged in all but two -- Pennsylvania and Washington -- where they declined.
Colorado and West Virginia remain the states with the lowest and highest rates of high blood pressure, respectively -- distinctions they have maintained since 2010. In fact, of the 11 states with the highest rates of high blood pressure in 2012, all but one -- Delaware -- were on the same list in 2011.
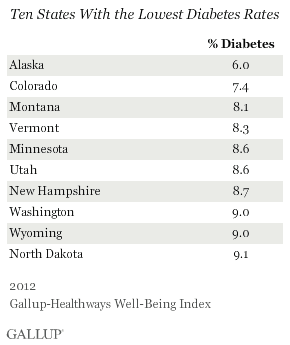
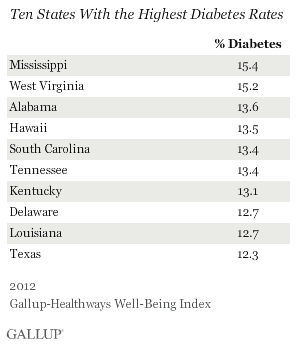
An average of 11% of Americans reported ever being diagnosed with diabetes last year, unchanged from 2011. Again, most states saw no change in diabetes rates.
Diabetes rates are highest in the same states where obesity and high blood pressure levels are highest: West Virginia and Mississippi. Louisiana, Kentucky, and Tennessee are also among the top 10 states with the highest rates of diabetes, high blood pressure, and obesity.
Bottom Line
Nationwide and across states, obesity rates remained relatively unchanged in 2012, but are still generally higher than they were in 2008. More than two in 10 adults are obese in all but one U.S. state, Colorado, as has been the case for the past few years. And in five U.S. states -- West Virginia, Mississippi, Arkansas, Louisiana, and Alabama -- more than three in 10 adults are obese. Similarly, high blood pressure and diabetes rates are, for the most part, static across states.
Obesity is now one of Americans' top health concerns -- surpassing smoking and alcohol -- with nearly four in 10 Americans saying it is an extremely serious problem to society. With obesity rates up in nearly all age groups since 2008, it is a problem that requires the nation's attention. The economic impact to the U.S. carries a heavy cost -- the Centers for Disease Control and Prevention reports that obesity alone costs about $147 billion annually.
As part of the Affordable Care Act, the government implemented a $15 billion Prevention and Public Health Fund in 2010 to invest in prevention programs -- ranging from obesity to smoking cessation -- to prevent disease and illness among Americans. Measures like this and other actions leaders and individuals can take in the years ahead may ultimately serve to curb the nation's obesity problem.
About the Gallup-Healthways Well-Being Index
The Gallup-Healthways Well-Being Index tracks well-being in the U.S. and provides best-in-class solutions for a healthier world. To learn more, please visit well-beingindex.com.
Survey Methods
Results are based on telephone interviews conducted as part of the Gallup-Healthways Well-Being Index survey Jan. 1-Dec. 31, 2012, with a random sample of 353,564 adults, aged 18 and older, living in all 50 U.S. states and the District of Columbia, selected using random-digit-dial sampling.
For results based on the total sample of national adults, one can say with 95% confidence that the maximum margin of sampling error is ±1 percentage point.
The margin of sampling error for most states is ±1 to ±2 percentage points, but is as high as ±4 points for states with smaller population sizes such as Alaska, Rhode Island, Vermont, Wyoming, North Dakota, South Dakota, Delaware, and Hawaii.
Interviews are conducted with respondents on landline telephones and cellular phones, with interviews conducted in Spanish for respondents who are primarily Spanish-speaking. Each sample includes a minimum quota of 400 cell phone respondents and 600 landline respondents per 1,000 national adults, with additional minimum quotas among landline respondents by region. Landline telephone numbers are chosen at random among listed telephone numbers. Cell phone numbers are selected using random-digit-dial methods. Landline respondents are chosen at random within each household on the basis of which member had the most recent birthday.
Samples are weighted by gender, age, race, Hispanic ethnicity, education, region, adults in the household, and phone status (cell phone only/landline only/both, cell phone mostly, and having an unlisted landline number). Demographic weighting targets are based on the March 2012 Current Population Survey figures for the aged 18 and older non-institutionalized population living in U.S. telephone households. All reported margins of sampling error include the computed design effects for weighting.
In addition to sampling error, question wording and practical difficulties in conducting surveys can introduce error or bias into the findings of public opinion polls.
For more details on Gallup's polling methodology, visit https://www.gallup.com/.
