PRINCETON, NJ -- Nearly nine in 10 Americans have an unfavorable view of Iran, making it the worst rated country out of 22 asked about. Seven other countries -- Libya, Iraq, Afghanistan, the Palestinian Authority, Syria, Pakistan, and North Korea -- also receive unfavorable ratings of 70% or more. Eighty percent or more of Americans have favorable images of Canada, Great Britain, Germany, and Japan.
![Next, I’d like your overall opinion of some foreign countries. What is your overall opinion of [RANDOM ORDER]? Is it very favorable, mostly favorable, mostly unfavorable, or very unfavorable? February 2013 results](http://content.gallup.com/origin/gallupinc/GallupSpaces/Production/Cms/POLL/eulrj9rqx0y64xzgr_apcg.gif)
These ratings were included in Gallup's World Affairs survey conducted Feb. 7-10, and provide a unique window into Americans' top-of-mind reactions toward a number of countries that are frequently in the news. Many of these reactions are negative: Americans give 15 out of the 22 countries a more unfavorable than favorable rating. Complete country ratings are found on page 2.
Gallup has monitored Americans' attitudes toward many of these countries for decades, and some, like Iran and North Korea, consistently get high or low favorable ratings. Gallup will review the long-term trends for each country next week on Gallup.com.
At this time, Americans' images of these countries stretch across a wide continuum from very positive to very negative.
- Americans react most positively to two English-speaking countries (Canada and Great Britain) that are longtime U.S. allies and to two countries -- Germany and Japan -- that were the major U.S. foes in World War II about 70 years ago. All four of these countries are now democracies with economic systems that in many ways reflect the same dynamics as the U.S. system.
- Three additional countries, France, India, and Israel, are "above water" -- although they are not at the top of the list, they engender attitudes from Americans that are much more favorable than unfavorable.
- Seven countries have higher unfavorable ratings than favorable, though generally not by very wide margins. These include Mexico, whose ratings almost break even, and Russia, China, and Venezuela. Venezuela's relatively high rating -- 40% of Americans hold favorable views, 47% unfavorable -- is interesting, given the strongly anti-American stance of that country's late leader, Hugo Chavez (these data were collected before his death). Egypt, Saudi Arabia, and Cuba are at the bottom of this third group; each receives a majority of unfavorable opinions.
- The eight countries with the most negative ratings all currently are or over the past decade were involved in wars, disputes, or turmoil -- in a number of instances, in ways that are overtly hostile to the U.S. The currently "hostile" category includes Iran and North Korea. Libya was overtly hostile toward the U.S. under the government of Moammar Gadhafi, and more recently was the country in which U.S. Ambassador Christopher Stevens and three other Americans were killed. The U.S. actively invaded two of the countries in this bottom tier -- Iraq and Afghanistan -- in efforts to overthrow their governments or controlling factions. Syria is in the middle of major domestic turmoil at this time. The U.S.-Pakistani relationship is beset with rockiness despite the strained cooperation between the two on military matters. And continuing Gallup research has shown that Americans strongly favor Israel's side of the enduring conflict between that country and the Palestinian Authority, helping explain why the latter is in this bottom group.
A Gallup analysis reveals additional patterns in the data worth highlighting:
- Of the two countries that border the U.S., Americans perceive Canada significantly more favorably than Mexico. There is a significant and positive correlation between ratings of these two countries such that Americans who rate one highly rate the other highly as well.
- Despite its status as a strong U.S. ally, Israel is not in the top group of countries. Israel and the Palestinian Authority comprise one of the few country pairs that are significantly correlated in a negative direction, meaning that Americans who rate one favorably tend to rate the other unfavorably.
- Cuba, despite its more than 50-year status as an implacable enemy of the U.S., is also not in the bottom group.
- Americans' images of Russia and China are now virtually identical. Americans' attitudes toward Russia and China are closely related, meaning those who rate one positively are also likely to rate the other positively.
- The strongest relationships in terms of Americans' ratings of two countries are between Great Britain and Canada and between Iraq and Afghanistan. Americans who like one of the countries in these pairs also strongly tend to like the other -- and the same is true for negative sentiment.
Americans Rate Certain Countries in Similar Ways
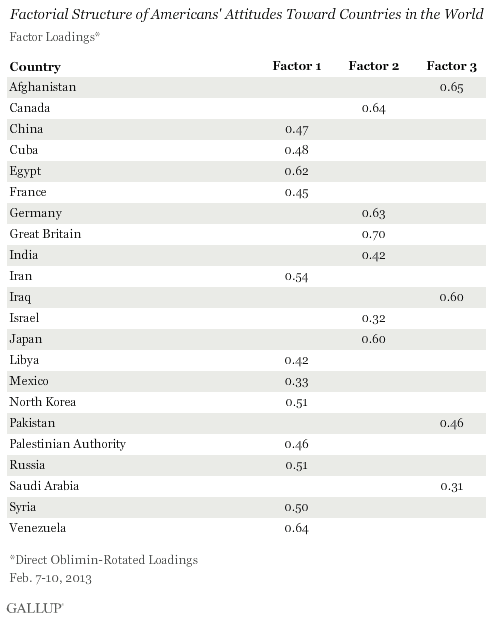
Gallup conducted an in-depth analysis to measure the factors that best explain the underlying structure in Americans' ratings of these 22 countries. (Complete results of the analysis are detailed on page 2.)
The analysis reveals there are three major relationships at play:
- Canada, Germany, Great Britain, India, Israel, and Japan: Americans who tend to be negative or positive about any of these countries tend to be negative or positive about the others in the group. All of these countries are democracies that are considered U.S. allies, regardless of their geographic differences and levels of development.
- China, Cuba, Egypt, France, Iran, Libya, Mexico, North Korea, the Palestinian Authority, Russia, Syria, and Venezuela: These are 12 countries in diverse geographic areas and with different styles of government. Americans who rate any of these countries favorably tend to rate the others favorably, and those who rate any of these countries unfavorably tend to rate the others unfavorably. Most of these countries are rated at the negative end of the overall scale. Many are not traditional democracies, two (Egypt and Syria) are undergoing wrenching problems at the moment, and most are not U.S. allies.
The surprises in this grouping are France and Mexico, the latter a democracy that has a long-shared border with the U.S. and the former a European democracy and industrialized country. Although Americans rate France and Mexico relatively highly overall, they tend to group their feelings about these two countries in ways similar to their feelings about the other countries listed here.
- Afghanistan, Iraq, Pakistan, and Saudi Arabia: Americans who are negative about Afghanistan or Iraq tend to be negative about Pakistan and Saudi Arabia, and the same applies to positive responses.
Bottom Line
Americans show widely diverse attitudes toward a group of 22 countries around the world, ranging from a 91% favorable rating for Canada to a 9% favorable rating for Iran.
The broad ways in which Americans rate these countries follow predictable patterns. Americans are most positive about countries that are democracies and U.S. allies, and least positive about countries that are seen as threats to the U.S., those that are involved in major turmoil, and those that are not traditional democracies.
Americans are more favorable than unfavorable about only seven of the 22 countries tested, underscoring that there are a number of countries around the world that engender negative reactions from the American public.
A Gallup analysis shows that in Americans' minds, these countries are generally divided into three groups. Americans tend to view Iraq, Afghanistan, Pakistan, and Saudi Arabia in similar ways, such that those who rate one of these countries high or low tend to rate the others in the same direction. Likewise, Americans tend to rate a group of six democratic allies -- Canada, Germany, Great Britain, India, Israel, and Japan -- similarly.
Survey Methods
Results for this Gallup poll are based on telephone interviews conducted Feb. 7-10, 2013, on the Gallup Daily tracking survey, with a random sample of 1,015 adults, aged 18 and older, living in all 50 U.S. states and the District of Columbia.
For results based on the total sample of national adults, one can say with 95% confidence that the margin of sampling error is ±4 percentage points.
Interviews are conducted with respondents on landline telephones and cellular phones, with interviews conducted in Spanish for respondents who are primarily Spanish-speaking. Each sample of national adults includes a minimum quota of 50% cellphone respondents and 50% landline respondents, with additional minimum quotas by region. Landline telephone numbers are chosen at random among listed telephone numbers. Cellphones numbers are selected using random digit dial methods. Landline respondents are chosen at random within each household on the basis of which member had the most recent birthday.
Samples are weighted to correct for unequal selection probability, nonresponse, and double coverage of landline and cell users in the two sampling frames. They are also weighted to match the national demographics of gender, age, race, Hispanic ethnicity, education, region, population density, and phone status (cellphone only/landline only/both, cellphone mostly, and having an unlisted landline number). Demographic weighting targets are based on the March 2012 Current Population Survey figures for the aged 18 and older U.S. population. Phone status targets are based on the July-December 2011 National Health Interview Survey. Population density targets are based on the 2010 census. All reported margins of sampling error include the computed design effects for weighting.
In addition to sampling error, question wording and practical difficulties in conducting surveys can introduce error or bias into the findings of public opinion polls.
View methodology, full question results, and trend data.
For more details on Gallup's polling methodology, visit www.gallup.com.
![Next, I’d like your overall opinion of some foreign countries. What is your overall opinion of [RANDOM ORDER]? Is it very favorable, mostly favorable, mostly unfavorable, or very unfavorable? February 2013 results](http://content.gallup.com/origin/gallupinc/GallupSpaces/Production/Cms/POLL/8wourjt0306af4b30k29la.gif)
Gallup conducted a factor analysis to measure the factors that most explain the underlying structure of Americans' ratings of 22 countries. The correlations among the three factors ranged from .10 to .43 -- all of which are significant). The accompanying table displays the results of this procedure.