Story Highlights
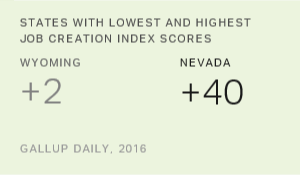
- Nevada rises to the top after a six-year climb from 50th place
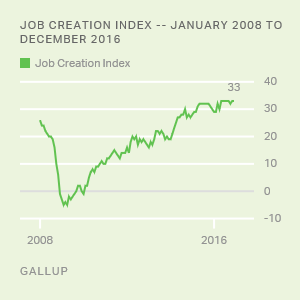
- National Job Creation Index score increases for seventh straight year
- Wyoming and North Dakota lose significant ground
WASHINGTON, D.C. -- Nevada led the way as the U.S. showed strong job growth in 2016, scoring highest among all states in Gallup's 2016 Job Creation Index. The rise to the top spot completed a six-year climb for Nevada, which ranked last among the states in both 2009 and 2010. Moving in the other direction, Wyoming scored last among the states for 2016 -- eight years after topping Gallup's first Job Creation Index in 2008.
| Index score | |||||||||||||||||||||||||||||||||||||||||||||||||||||||||||||||||||||||||||||||||||||||||||||||||||
|---|---|---|---|---|---|---|---|---|---|---|---|---|---|---|---|---|---|---|---|---|---|---|---|---|---|---|---|---|---|---|---|---|---|---|---|---|---|---|---|---|---|---|---|---|---|---|---|---|---|---|---|---|---|---|---|---|---|---|---|---|---|---|---|---|---|---|---|---|---|---|---|---|---|---|---|---|---|---|---|---|---|---|---|---|---|---|---|---|---|---|---|---|---|---|---|---|---|---|---|
| Nevada | +40 | ||||||||||||||||||||||||||||||||||||||||||||||||||||||||||||||||||||||||||||||||||||||||||||||||||
| Utah | +38 | ||||||||||||||||||||||||||||||||||||||||||||||||||||||||||||||||||||||||||||||||||||||||||||||||||
| Georgia | +37 | ||||||||||||||||||||||||||||||||||||||||||||||||||||||||||||||||||||||||||||||||||||||||||||||||||
| Michigan | +37 | ||||||||||||||||||||||||||||||||||||||||||||||||||||||||||||||||||||||||||||||||||||||||||||||||||
| Minnesota | +36 | ||||||||||||||||||||||||||||||||||||||||||||||||||||||||||||||||||||||||||||||||||||||||||||||||||
| South Carolina | +36 | ||||||||||||||||||||||||||||||||||||||||||||||||||||||||||||||||||||||||||||||||||||||||||||||||||
| Washington | +36 | ||||||||||||||||||||||||||||||||||||||||||||||||||||||||||||||||||||||||||||||||||||||||||||||||||
| Wisconsin | +35 | ||||||||||||||||||||||||||||||||||||||||||||||||||||||||||||||||||||||||||||||||||||||||||||||||||
| Arizona | +34 | ||||||||||||||||||||||||||||||||||||||||||||||||||||||||||||||||||||||||||||||||||||||||||||||||||
| California | +34 | ||||||||||||||||||||||||||||||||||||||||||||||||||||||||||||||||||||||||||||||||||||||||||||||||||
| Florida | +34 | ||||||||||||||||||||||||||||||||||||||||||||||||||||||||||||||||||||||||||||||||||||||||||||||||||
| Indiana | +34 | ||||||||||||||||||||||||||||||||||||||||||||||||||||||||||||||||||||||||||||||||||||||||||||||||||
| Maryland | +34 | ||||||||||||||||||||||||||||||||||||||||||||||||||||||||||||||||||||||||||||||||||||||||||||||||||
| Massachusetts | +34 | ||||||||||||||||||||||||||||||||||||||||||||||||||||||||||||||||||||||||||||||||||||||||||||||||||
| Nebraska | +34 | ||||||||||||||||||||||||||||||||||||||||||||||||||||||||||||||||||||||||||||||||||||||||||||||||||
| Gallup Daily, January-December 2016 | |||||||||||||||||||||||||||||||||||||||||||||||||||||||||||||||||||||||||||||||||||||||||||||||||||
Each night in its Gallup Daily tracking survey, Gallup asks employed Americans to report on hiring activity at their place of work. Gallup's Job Creation Index is based on the percentage of workers saying their place of employment is increasing the size of its workforce, minus the percentage saying their place of employment is reducing the size of its workforce.
For the nation overall, the Job Creation Index score has grown each year since 2009, from -1 to +32 in 2016 (43% hiring, 11% letting go). Rankings for all 50 states can be found at the bottom of this article.
Nevada's score of +40 marks the seventh straight year the state's workers have reported an improved job market. The state's -13 score in 2009, when it was reeling from the housing market collapse and severe cutbacks in tourism, ties with Michigan's score for the same year as the lowest for any state in the index's nine-year history. Michigan has made a similarly impressive upward climb, buoyed by the strong recovery in automobile sales, with its score of +37 in 2016 tying for third highest with Georgia. Utah, which has ranked in the top 10 six times, was second among the states last year, with a score of +38.
Also of note:
- The strongest regional presence among the top states for job creation comes from three Great Lakes states -- Minnesota, Wisconsin and Michigan.
- Only two states with top 10 scores this year have not been ranked there previously -- California and Massachusetts.
- Nebraska is the only state to rank in the top 10 every year since tracking began in 2008.
North Dakota Falls Farthest on State Rankings
The bottom of the rankings include two major changes, both occurring in states relying heavily on the energy sector:
- Wyoming's score dropped 18 points to +2 in 2016. This is the first time since 2011 that a state did not have a score of at least +10.
- North Dakota, which was at the top of the rankings in six of the previous eight years and never outside the top 10, dropped into the bottom 10 last year.
| Index score | |||||||||||||||||||||||||||||||||||||||||||||||||||||||||||||||||||||||||||||||||||||||||||||||||||
|---|---|---|---|---|---|---|---|---|---|---|---|---|---|---|---|---|---|---|---|---|---|---|---|---|---|---|---|---|---|---|---|---|---|---|---|---|---|---|---|---|---|---|---|---|---|---|---|---|---|---|---|---|---|---|---|---|---|---|---|---|---|---|---|---|---|---|---|---|---|---|---|---|---|---|---|---|---|---|---|---|---|---|---|---|---|---|---|---|---|---|---|---|---|---|---|---|---|---|---|
| Wyoming | +2 | ||||||||||||||||||||||||||||||||||||||||||||||||||||||||||||||||||||||||||||||||||||||||||||||||||
| Alaska | +14 | ||||||||||||||||||||||||||||||||||||||||||||||||||||||||||||||||||||||||||||||||||||||||||||||||||
| West Virginia | +15 | ||||||||||||||||||||||||||||||||||||||||||||||||||||||||||||||||||||||||||||||||||||||||||||||||||
| Montana | +19 | ||||||||||||||||||||||||||||||||||||||||||||||||||||||||||||||||||||||||||||||||||||||||||||||||||
| Oklahoma | +19 | ||||||||||||||||||||||||||||||||||||||||||||||||||||||||||||||||||||||||||||||||||||||||||||||||||
| Louisiana | +20 | ||||||||||||||||||||||||||||||||||||||||||||||||||||||||||||||||||||||||||||||||||||||||||||||||||
| North Dakota | +21 | ||||||||||||||||||||||||||||||||||||||||||||||||||||||||||||||||||||||||||||||||||||||||||||||||||
| New Mexico | +22 | ||||||||||||||||||||||||||||||||||||||||||||||||||||||||||||||||||||||||||||||||||||||||||||||||||
| Vermont | +22 | ||||||||||||||||||||||||||||||||||||||||||||||||||||||||||||||||||||||||||||||||||||||||||||||||||
| Connecticut | +24 | ||||||||||||||||||||||||||||||||||||||||||||||||||||||||||||||||||||||||||||||||||||||||||||||||||
| Kansas | +24 | ||||||||||||||||||||||||||||||||||||||||||||||||||||||||||||||||||||||||||||||||||||||||||||||||||
| Maine | +25 | ||||||||||||||||||||||||||||||||||||||||||||||||||||||||||||||||||||||||||||||||||||||||||||||||||
| Alabama | +26 | ||||||||||||||||||||||||||||||||||||||||||||||||||||||||||||||||||||||||||||||||||||||||||||||||||
| Hawaii | +26 | ||||||||||||||||||||||||||||||||||||||||||||||||||||||||||||||||||||||||||||||||||||||||||||||||||
| Kentucky | +27 | ||||||||||||||||||||||||||||||||||||||||||||||||||||||||||||||||||||||||||||||||||||||||||||||||||
| Mississippi | +27 | ||||||||||||||||||||||||||||||||||||||||||||||||||||||||||||||||||||||||||||||||||||||||||||||||||
| New Jersey | +27 | ||||||||||||||||||||||||||||||||||||||||||||||||||||||||||||||||||||||||||||||||||||||||||||||||||
| Gallup Daily, January-December 2016 | |||||||||||||||||||||||||||||||||||||||||||||||||||||||||||||||||||||||||||||||||||||||||||||||||||
Two types of states dominate the bottom 10 -- those whose economies depend heavily on the oil, gas or coal industry and those with small populations. In addition to Wyoming and North Dakota, other low-ranking states relying heavily on the energy sector include Louisiana, West Virginia, Alaska and Oklahoma. Only Louisiana is among the upper half of states in population, and it is ranked 25th. All four of the least populous states -- Wyoming, Vermont, Alaska and North Dakota -- make the bottom 10.
The most glaring exception to this is Connecticut -- the only state that has stayed in the bottom 10 every year since 2008. It is not dependent to a great extent on an energy industry and is one of the most populous states on the list.
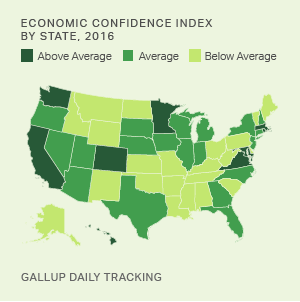
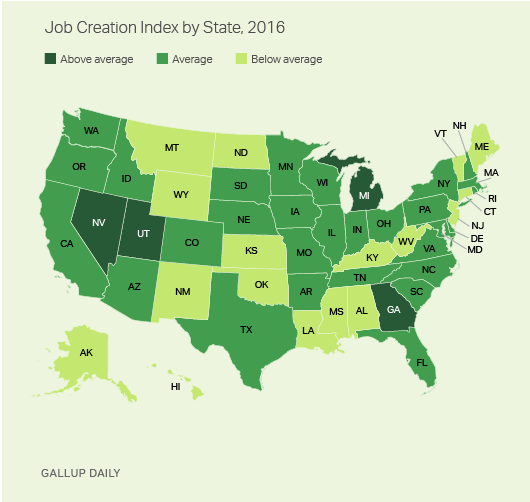
Four States Significantly Above U.S. Average, 17 Below Average
Among the four states with Job Creation Index scores at least five points above the national average, Nevada and Utah share a long common border, but the other two -- Georgia and Michigan -- are from two other regions.
Six of the states scoring at least five points below the national average are located in the vast area between the Rockies and the Mississippi River, three are in the Deep South, four are in New England, and two are in Appalachia.
Bottom Line
As the U.S. economy continues its upward journey from the depths of the Great Recession, there is considerable instability in the state rankings for new job creation. Only five of the states with the top 10 scores in 2016 were among the top 10 scorers in 2013, and only five with the bottom 10 scores last year were on the same list just three years ago.
Even with the instability, it has become increasingly clear that the big losers have been states relying heavily on jobs tied to the energy industry. Wyoming, North Dakota, Louisiana, Alaska, Oklahoma and West Virginia all ranked in the top four states for job creation in either 2008, 2009 or 2010, when the price of oil often soared. In both of the last two years, with oil prices much lower than a decade ago, all but North Dakota have ranked in the bottom 10. Further, all of those states except Louisiana scored lower in job creation in 2016 than in 2011, during a period when the national score more than doubled, from +14 to +32. On the positive side, there are signs that the oil industry may be poised for a comeback.
Outside of the energy-dependent states, almost every state -- no matter where it currently ranks -- has improved its job creation score over the last two years.
There are reasons for concern about the slow pace of job creation in a handful of states, such as Wyoming. Still, most states have made strong gains in new job creation since 2010, and that growth continued in 2016.
These data are available in Gallup Analytics.
Survey Methods
Results for this Gallup poll are based on telephone interviews conducted Jan. 2-Dec. 30, 2016, on the Gallup Daily tracking survey, with a random sample of 210,448 employed adults, aged 18 and older, living in all 50 U.S. states and the District of Columbia. For results based on the total sample of working adults, the margin of sampling error is ±1 percentage point at the 95% confidence level.
Margins of error for individual states are no greater than ±6 percentage points, and are ±3 percentage points in most states. All reported margins of sampling error include computed design effects for weighting.
Each sample of national adults includes a minimum quota of 60% cellphone respondents and 40% landline respondents, with additional minimum quotas by time zone within region. Landline and cellular telephone numbers are selected using random-digit-dial methods.
Learn more about how Gallup Daily tracking works.
| Expanding workforce | Not changing | Reducing workforce | Index score | Number of interviews | |||||||||||||||||||||||||||||||||||||||||||||||||||||||||||||||||||||||||||||||||||||||||||||||
|---|---|---|---|---|---|---|---|---|---|---|---|---|---|---|---|---|---|---|---|---|---|---|---|---|---|---|---|---|---|---|---|---|---|---|---|---|---|---|---|---|---|---|---|---|---|---|---|---|---|---|---|---|---|---|---|---|---|---|---|---|---|---|---|---|---|---|---|---|---|---|---|---|---|---|---|---|---|---|---|---|---|---|---|---|---|---|---|---|---|---|---|---|---|---|---|---|---|---|---|
| Nevada | 49% | 36% | 9% | +40 | 1,596 | ||||||||||||||||||||||||||||||||||||||||||||||||||||||||||||||||||||||||||||||||||||||||||||||
| Utah | 46% | 41% | 8% | +38 | 2,618 | ||||||||||||||||||||||||||||||||||||||||||||||||||||||||||||||||||||||||||||||||||||||||||||||
| Michigan | 46% | 41% | 9% | +37 | 5,484 | ||||||||||||||||||||||||||||||||||||||||||||||||||||||||||||||||||||||||||||||||||||||||||||||
| Georgia | 47% | 38% | 10% | +37 | 6,637 | ||||||||||||||||||||||||||||||||||||||||||||||||||||||||||||||||||||||||||||||||||||||||||||||
| South Carolina | 46% | 38% | 10% | +36 | 3,032 | ||||||||||||||||||||||||||||||||||||||||||||||||||||||||||||||||||||||||||||||||||||||||||||||
| Minnesota | 44% | 43% | 8% | +36 | 4,164 | ||||||||||||||||||||||||||||||||||||||||||||||||||||||||||||||||||||||||||||||||||||||||||||||
| Washington | 45% | 40% | 9% | +36 | 5,272 | ||||||||||||||||||||||||||||||||||||||||||||||||||||||||||||||||||||||||||||||||||||||||||||||
| Wisconsin | 45% | 42% | 10% | +35 | 3,984 | ||||||||||||||||||||||||||||||||||||||||||||||||||||||||||||||||||||||||||||||||||||||||||||||
| Arizona | 45% | 37% | 11% | +34 | 4,678 | ||||||||||||||||||||||||||||||||||||||||||||||||||||||||||||||||||||||||||||||||||||||||||||||
| California | 44% | 39% | 10% | +34 | 21,140 | ||||||||||||||||||||||||||||||||||||||||||||||||||||||||||||||||||||||||||||||||||||||||||||||
| Florida | 44% | 38% | 10% | +34 | 11,518 | ||||||||||||||||||||||||||||||||||||||||||||||||||||||||||||||||||||||||||||||||||||||||||||||
| Indiana | 44% | 41% | 10% | +34 | 4,382 | ||||||||||||||||||||||||||||||||||||||||||||||||||||||||||||||||||||||||||||||||||||||||||||||
| Maryland | 45% | 38% | 11% | +34 | 4,140 | ||||||||||||||||||||||||||||||||||||||||||||||||||||||||||||||||||||||||||||||||||||||||||||||
| Massachusetts | 43% | 42% | 9% | +34 | 5,037 | ||||||||||||||||||||||||||||||||||||||||||||||||||||||||||||||||||||||||||||||||||||||||||||||
| Nebraska | 43% | 43% | 9% | +34 | 1,915 | ||||||||||||||||||||||||||||||||||||||||||||||||||||||||||||||||||||||||||||||||||||||||||||||
| Colorado | 43% | 42% | 10% | +33 | 4,437 | ||||||||||||||||||||||||||||||||||||||||||||||||||||||||||||||||||||||||||||||||||||||||||||||
| Ohio | 44% | 41% | 11% | +33 | 7,076 | ||||||||||||||||||||||||||||||||||||||||||||||||||||||||||||||||||||||||||||||||||||||||||||||
| Tennessee | 44% | 40% | 11% | +33 | 4,721 | ||||||||||||||||||||||||||||||||||||||||||||||||||||||||||||||||||||||||||||||||||||||||||||||
| Oregon | 42% | 43% | 9% | +33 | 3,358 | ||||||||||||||||||||||||||||||||||||||||||||||||||||||||||||||||||||||||||||||||||||||||||||||
| Virginia | 44% | 40% | 11% | +33 | 6,416 | ||||||||||||||||||||||||||||||||||||||||||||||||||||||||||||||||||||||||||||||||||||||||||||||
| Idaho | 40% | 47% | 7% | +33 | 1,423 | ||||||||||||||||||||||||||||||||||||||||||||||||||||||||||||||||||||||||||||||||||||||||||||||
| North Carolina | 44% | 39% | 11% | +33 | 6,643 | ||||||||||||||||||||||||||||||||||||||||||||||||||||||||||||||||||||||||||||||||||||||||||||||
| Missouri | 42% | 43% | 10% | +32 | 4,002 | ||||||||||||||||||||||||||||||||||||||||||||||||||||||||||||||||||||||||||||||||||||||||||||||
| Texas | 43% | 38% | 13% | +30 | 16,501 | ||||||||||||||||||||||||||||||||||||||||||||||||||||||||||||||||||||||||||||||||||||||||||||||
| Iowa | 40% | 45% | 10% | +30 | 2,520 | ||||||||||||||||||||||||||||||||||||||||||||||||||||||||||||||||||||||||||||||||||||||||||||||
| New York | 41% | 41% | 11% | +30 | 12,961 | ||||||||||||||||||||||||||||||||||||||||||||||||||||||||||||||||||||||||||||||||||||||||||||||
| South Dakota | 38% | 49% | 8% | +30 | 734 | ||||||||||||||||||||||||||||||||||||||||||||||||||||||||||||||||||||||||||||||||||||||||||||||
| Illinois | 42% | 41% | 13% | +29 | 6,831 | ||||||||||||||||||||||||||||||||||||||||||||||||||||||||||||||||||||||||||||||||||||||||||||||
| Rhode Island | 41% | 40% | 12% | +29 | 736 | ||||||||||||||||||||||||||||||||||||||||||||||||||||||||||||||||||||||||||||||||||||||||||||||
| Pennsylvania | 41% | 42% | 12% | +29 | 9,274 | ||||||||||||||||||||||||||||||||||||||||||||||||||||||||||||||||||||||||||||||||||||||||||||||
| New Hampshire | 39% | 46% | 11% | +28 | 921 | ||||||||||||||||||||||||||||||||||||||||||||||||||||||||||||||||||||||||||||||||||||||||||||||
| Delaware | 41% | 42% | 13% | +28 | 534 | ||||||||||||||||||||||||||||||||||||||||||||||||||||||||||||||||||||||||||||||||||||||||||||||
| Arkansas | 40% | 42% | 12% | +28 | 2,053 | ||||||||||||||||||||||||||||||||||||||||||||||||||||||||||||||||||||||||||||||||||||||||||||||
| New Jersey | 40% | 40% | 13% | +27 | 5,928 | ||||||||||||||||||||||||||||||||||||||||||||||||||||||||||||||||||||||||||||||||||||||||||||||
| Kentucky | 40% | 42% | 13% | +27 | 2,849 | ||||||||||||||||||||||||||||||||||||||||||||||||||||||||||||||||||||||||||||||||||||||||||||||
| Mississippi | 39% | 43% | 12% | +27 | 1,753 | ||||||||||||||||||||||||||||||||||||||||||||||||||||||||||||||||||||||||||||||||||||||||||||||
| Hawaii | 38% | 42% | 12% | +26 | 724 | ||||||||||||||||||||||||||||||||||||||||||||||||||||||||||||||||||||||||||||||||||||||||||||||
| Alabama | 39% | 43% | 13% | +26 | 3,124 | ||||||||||||||||||||||||||||||||||||||||||||||||||||||||||||||||||||||||||||||||||||||||||||||
| Maine | 36% | 46% | 11% | +25 | 1,207 | ||||||||||||||||||||||||||||||||||||||||||||||||||||||||||||||||||||||||||||||||||||||||||||||
| Connecticut | 38% | 43% | 14% | +24 | 2,578 | ||||||||||||||||||||||||||||||||||||||||||||||||||||||||||||||||||||||||||||||||||||||||||||||
| Kansas | 37% | 44% | 13% | +24 | 2,201 | ||||||||||||||||||||||||||||||||||||||||||||||||||||||||||||||||||||||||||||||||||||||||||||||
| New Mexico | 36% | 41% | 14% | +22 | 1,603 | ||||||||||||||||||||||||||||||||||||||||||||||||||||||||||||||||||||||||||||||||||||||||||||||
| Vermont | 32% | 52% | 10% | +22 | 684 | ||||||||||||||||||||||||||||||||||||||||||||||||||||||||||||||||||||||||||||||||||||||||||||||
| North Dakota | 34% | 48% | 13% | +21 | 702 | ||||||||||||||||||||||||||||||||||||||||||||||||||||||||||||||||||||||||||||||||||||||||||||||
| Louisiana | 37% | 40% | 17% | +20 | 2,732 | ||||||||||||||||||||||||||||||||||||||||||||||||||||||||||||||||||||||||||||||||||||||||||||||
| Oklahoma | 35% | 43% | 16% | +19 | 3,057 | ||||||||||||||||||||||||||||||||||||||||||||||||||||||||||||||||||||||||||||||||||||||||||||||
| Montana | 32% | 50% | 13% | +19 | 1,298 | ||||||||||||||||||||||||||||||||||||||||||||||||||||||||||||||||||||||||||||||||||||||||||||||
| West Virginia | 34% | 41% | 19% | +15 | 1,126 | ||||||||||||||||||||||||||||||||||||||||||||||||||||||||||||||||||||||||||||||||||||||||||||||
| Alaska | 32% | 45% | 18% | +14 | 755 | ||||||||||||||||||||||||||||||||||||||||||||||||||||||||||||||||||||||||||||||||||||||||||||||
| Wyoming | 23% | 50% | 21% | +2 | 712 | ||||||||||||||||||||||||||||||||||||||||||||||||||||||||||||||||||||||||||||||||||||||||||||||
| Among employed U.S. adults, aged 18 and older | |||||||||||||||||||||||||||||||||||||||||||||||||||||||||||||||||||||||||||||||||||||||||||||||||||
| Gallup Daily, January-December 2016 | |||||||||||||||||||||||||||||||||||||||||||||||||||||||||||||||||||||||||||||||||||||||||||||||||||