This is the first in a four-part series on the "State of the States" to be released this week on Gallup.com. The series examines state-by-state differences in party affiliation, religiosity, consumer confidence, and employer hiring and letting go, based on Gallup Poll Daily tracking data collected throughout 2008.
PRINCETON, NJ -- An analysis of Gallup Poll Daily tracking data from 2008 finds Rhode Island, Massachusetts, and Hawaii to be the most Democratic states in the nation, along with the District of Columbia. Utah and Wyoming are the most Republican states.
In 2008, Gallup interviewed more than 350,000 U.S. adults as part of Gallup Poll Daily tracking. That includes interviews with 1,000 or more residents of every U.S. state except Wyoming (885) and North Dakota (953), as well as the District of Columbia (689). There were more than 15,000 interviews conducted with residents of California, New York, Pennsylvania, Texas, and Florida.
This large data set provides the unique ability to give reliable estimates of state-level characteristics for 2008. Each sample of state residents was weighted by demographic characteristics to ensure it is representative of the state's population.
In order to rank the states on partisanship, Gallup analyzes "leaned" party identification by state. This measure adds partisan-leaning independents to the percentage who identify with either of the parties. Thus, the Republican total includes Republican identifiers and independents who lean Republican, and the Democratic total likewise includes Democratic identifiers and independents who lean Democratic.
This helps makes the state data more comparable because the percentage who identify as political independents varies greatly by state, from a low of 25% in the District of Columbia to a high of 53% in Rhode Island.
The accompanying map shows party strength by state for 2008, ranging from states that can be considered solidly Democratic (a Democratic advantage in party identification of 10 percentage points or more) to those that can be considered solidly Republican (a Republican advantage in party identification of 10 percentage points or more). States in which the partisan advantage is less than 5 points in either direction are considered "competitive." (The full data for all states appear at the end of the article.)
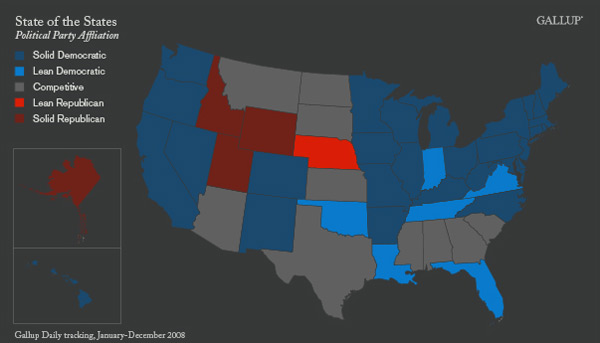
What is immediately clear from the map is that residents of the United States were very Democratic in their political orientation last year. In fact, Gallup has earlier reported that a majority of Americans nationwide said they identified with or leaned to the Democratic Party in 2008.
All told, 29 states and the District of Columbia had Democratic party affiliation advantages of 10 points or greater last year. This includes all of the states in the Northeast, and all but Indiana in the Great Lakes region. There are even several Southern states in this grouping, including Arkansas, North Carolina, and Kentucky.
An additional six states had Democratic advantages ranging between 5 and 9 points.
In contrast, only five states had solid or leaning Republican orientations in 2008, with Utah, Wyoming, Idaho, and Alaska in the former group, and Nebraska in the latter.
The most balanced political states in 2008 were Texas (+2 Democratic), South Dakota (+1), Mississippi (+1), North Dakota (+1), South Carolina (even), Arizona (even), Alabama (+1 Republican), and Kansas (+2 Republican).
Relation to 2008 Election Outcome
Given that most states had a Democratic advantage in party affiliation last year, to some degree it can be argued that Barack Obama could have won many more electoral votes than he did. In fact, Obama won 28 states (plus the District of Columbia) to John McCain's 22 in the 2008 election.
There are several reasons for possible disparities between the party affiliation data and the voting outcomes in a given state. First, turnout has typically been an equalizer in U.S. electoral politics because Democrats almost always have an advantage in identification, but Republicans have been competitive in national and state elections over the last three decades because Republicans are usually more likely than Democrats to vote. Second, one's partisan leaning is not a perfect predictor of voting in a presidential election, in which candidate-specific characteristics can influence a voter's choice. Third, the party affiliation data reported here cover all of 2008, while presidential election voting was limited to Nov. 4 or the weeks leading up to it.
But the rank-ordering of the states on the Democratic-to-Republican continuum generally follows the election results quite closely -- Obama won 22 of the 23 most Democratic states (West Virginia being the only exception), and McCain won the 17 most Republican states.
Virginia, Florida, and Indiana (all with +9 Democratic partisanship advantages) are arguably the most impressive wins for Obama, since they were the least Democratic states he won. McCain managed to win West Virginia, which had a 19-point Democratic advantage, as well as three other solidly Democratic states -- Kentucky (+13), Arkansas (+12), and Missouri (+11). McCain also swept the states that had narrow Democratic advantages of less than five points.
Implications
The political landscape of the United States has clearly shifted in the Democratic direction, and in most states, a greater proportion of state residents identified as Democrats or said they leaned to the Democratic Party in 2008 than identified as Republicans or leaned Republican.
As recently as 2002, a majority of states were Republican in orientation. By 2005, movement in the Democratic direction was becoming apparent, and this continued in 2006. That dramatic turnaround is clearly an outgrowth of Americans' dissatisfaction with the way the Republicans (in particular, President George W. Bush) governed the country.
With Democratic support at the national level the highest in more than two decades and growing each of the last five years, Republican prospects for significant gains in power in the near term do not appear great. But the recent data do show that party support can change rather dramatically in a relatively short period of time.
Survey Methods
Results are based on telephone interviews with 355,334 national adults, aged 18 and older, conducted in 2008 as part of Gallup Poll Daily tracking. For results based on the total sample of national adults, one can say with 95% confidence that the maximum margin of sampling error is ±1 percentage point.
The margin of sampling error for most states is ±1 percentage point, but is as high as ±4 percentage points for the District of Columbia, Wyoming, and North Dakota.
Interviews are conducted with respondents on land-line telephones (for respondents with a land-line telephone) and cellular phones (for respondents who are cell-phone only).
In addition to sampling error, question wording and practical difficulties in conducting surveys can introduce error or bias into the findings of public opinion polls.