GALLUP NEWS SERVICE
PRINCETON, NJ -- CNN/USA Today/Gallup's weekend poll shows that the Democratic Party's convention in Boston last week did little to change whether Americans view Democratic presidential nominee John Kerry favorably or unfavorably. However, vice presidential nominee John Edwards' favorable rating improved, as did that of the Democratic Party more generally. Teresa Heinz Kerry's favorable and unfavorable ratings both increased significantly following the convention. And while the public's views of President George W. Bush didn't change following the convention, ratings of the Republican Party showed a slight dip.
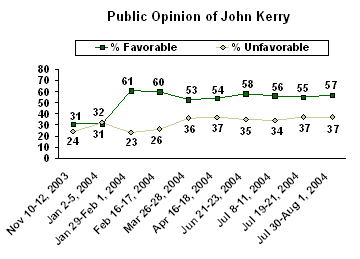
The post-convention poll, conducted July 30-Aug. 1, finds 57% of Americans with a favorable view of Kerry and 37% with an unfavorable view. Prior to the convention, 55% of the public rated Kerry favorably, with the same 37% unfavorable rating. Among likely voters, Kerry's favorable rating showed a slight drop, from 58% in the pre-convention poll to 54% in the post-convention poll.
These results suggest the convention did little to improve the public's most basic attitudes about Kerry. By comparison, 2000 Democratic presidential nominee Al Gore's favorable rating jumped from 52% to 64% following the 2000 Democratic convention, while Bush's increased from 63% to 67% after the 2000 Republican convention. However, it is becoming increasingly clear that the 2004 campaign is unlike most elections, with interest in the election running at historically high levels and with most voters having made up their minds early.
Kerry's favorable rating among all Americans has been above 50% since his surprising Iowa caucus victory, which propelled him to front-runner status in the Democratic presidential nomination contest. Kerry's favorable rating reached as high as 61% this year.
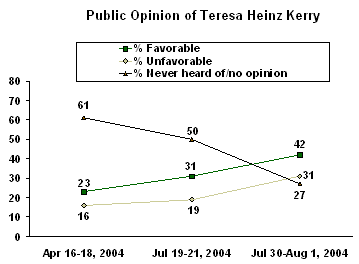
While apparently doing little to aid opinions of the Democratic presidential nominee, the convention did increase both the favorable and unfavorable ratings of the woman who could be the country's next first lady -- Heinz Kerry. The convention afforded her an opportunity to raise her public profile, and indeed the percentage of Americans without an opinion of her dropped significantly following the convention.
Heinz Kerry gave a prime-time address on the second night of the convention, and also made news for an unfriendly encounter with a reporter prior to her arrival at the convention. The July 19-21 pre-convention CNN/USA Today/Gallup poll showed half of Americans without an opinion of Kerry's wife, with 31% viewing her favorably and 19% unfavorably. Now, only about one in four Americans do not have an opinion of her, while her favorable and unfavorable ratings have increased by about equal amounts -- an 11-point increase in her favorable rating to 42%, and a 12-point increase in her unfavorable rating to 31%.
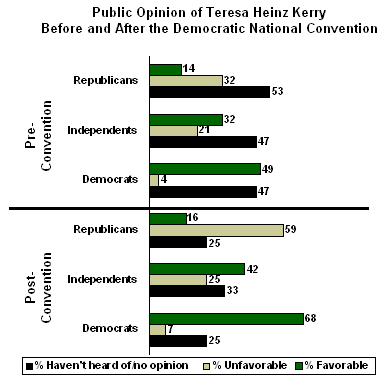
The convention and surrounding events definitely helped to make views of Heinz Kerry much more polarized than before -- a majority of Democrats now view her favorably (68%, compared with 49% pre-convention), while a majority of Republicans currently view her unfavorably (59%, compared with 32% before the convention).
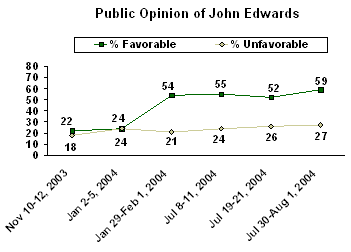
Edwards, Kerry's former rival for the presidential nomination, also became a more recognizable figure following the convention, seeing his name identification increase from 78% to 86%. Fifty-nine percent of Americans overall now view him favorably while 27% view him unfavorably, with the remaining 14% not having an opinion. That reflects a seven-point increase from his 52% pre-convention favorable rating, while his unfavorable rating stayed essentially the same (it was 26% before the convention). The current 59% favorable rating is the most positive for Edwards to date.
The public's views of the Democratic Party more generally also became more positive following the convention. Fifty-five percent of the public now holds a favorable view of the party, compared with 48% immediately before the convention. A similar pattern occurred after the 1996 convention (no data are available for 2000), with the party's favorable rating increasing five points among registered voters following that year's convention, from 55% to 60%.
The Republicans
The Democratic convention did nothing to change the public's basic views of Bush. Since early July, 52% of Americans have held a favorable view of the president -- a mark tying the lowest favorable rating during Bush's presidency. Only this year did his favorable ratings drop below the 60% mark.
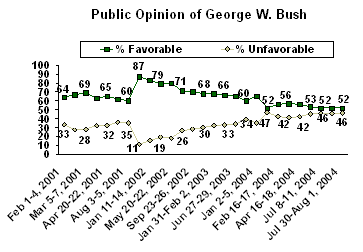
Likely voters' ratings of Bush also remained relatively stable before (53% favorable) and after (55%) the Democratic convention.
Bush's favorable ratings have tended to run below Kerry's this year, and one reason is that Bush is a somewhat more polarizing figure. Currently, 94% of Republicans rate him favorably, while only 16% of Democrats do -- a gap of 78 percentage points. In contrast, Kerry gets positive ratings from 90% of Democrats and 19% of Republicans -- a gap of 71 points. A second reason is that independents tend to have a net positive view of Kerry (in the last two polls at least 54% rated him positively), while they have a net negative view of Bush (in the last two polls, at least 51% have rated him negatively).
Ratings of the Republican Party more generally have basically stayed stable, although they show evidence of a slight decline (from 50% before the convention to 47% after). In 1996, a similar pattern occurred, as these ratings declined following the Democratic convention, from 55% to 50% among registered voters.
Survey Methods
These results are based on telephone interviews with a randomly selected national sample of 1,518 adults, aged 18 and older, conducted July 30-Aug. 1, 2004. For results based on this sample, one can say with 95% confidence that the maximum error attributable to sampling and other random effects is ±3 percentage points. In addition to sampling error, question wording and practical difficulties in conducting surveys can introduce error or bias into the findings of public opinion polls.
9. Next, we'd like to get your overall opinion of some people in the news. As I read each name, please say if you have a favorable or unfavorable opinion of these people -- or if you have never heard of them. First, ... How about... [ITEM A READ FIRST, THEN ITEMS B-D ROTATED, THEN ITEM E READ, THEN ITEMS F-G ROTATED]
A. George W. Bush
|
|
|
Never |
No |
|
|
% |
% |
% |
% |
|
|
2004 Jul 30-Aug 1 |
52 |
46 |
-- |
2 |
|
2004 Jul 19-21 |
52 |
46 |
-- |
2 |
|
2004 Jul 8-11 |
52 |
46 |
-- |
2 |
|
2004 Jun 21-23 |
53 |
45 |
-- |
2 |
|
2004 Apr 16-18 |
56 |
42 |
-- |
2 |
|
2004 Mar 26-28 |
57 |
41 |
-- |
2 |
|
2004 Feb 16-17 |
56 |
42 |
-- |
2 |
|
2004 Jan 29-Feb 1 |
52 |
47 |
-- |
1 |
|
2004 Jan 2-5 |
65 |
35 |
-- |
* |
|
2003 Oct 6-8 |
60 |
39 |
-- |
1 |
|
2003 Jun 27-29 |
65 |
34 |
-- |
1 |
|
2003 Jun 9-10 |
66 |
33 |
-- |
1 |
|
2003 Jan 31-Feb 2 |
68 |
32 |
-- |
* |
|
2002 Dec 16-17 |
68 |
30 |
-- |
2 |
|
2002 Sep 23-26 |
70 |
28 |
-- |
2 |
|
2002 Jul 26-28 |
71 |
26 |
-- |
3 |
|
2002 May 20-22 |
80 |
18 |
-- |
2 |
|
2002 Apr 29-May 1 |
79 |
19 |
-- |
2 |
|
2002 Jan 11-14 |
83 |
15 |
-- |
2 |
|
2001 Nov 26-27 |
87 |
11 |
-- |
2 |
|
2001 Aug 3-5 |
60 |
35 |
1 |
4 |
|
2001 Jun 8-10 |
62 |
36 |
* |
2 |
|
2001 Apr 20-22 |
65 |
32 |
0 |
3 |
|
2001 Mar 9-11 |
63 |
32 |
0 |
5 |
|
2001 Mar 5-7 |
69 |
28 |
* |
3 |
|
2001 Feb 19-21 |
67 |
27 |
* |
6 |
|
2001 Feb 1-4 |
64 |
33 |
* |
3 |
|
2001 Jan 15-16 |
62 |
36 |
* |
2 |
|
2000 Dec 15-17 |
59 |
36 |
1 |
4 |
|
2000 Dec 2-4 |
56 |
40 |
* |
4 |
|
2000 Nov 13-15 |
53 |
43 |
* |
4 |
|
2000 Nov 4-5 ^ |
55 |
39 |
* |
6 |
|
2000 Oct 24-26 ^ |
62 |
33 |
* |
5 |
|
2000 Oct 23-25 ^ |
60 |
35 |
* |
5 |
|
2000 Oct 20-22 ^ |
59 |
37 |
* |
4 |
|
2000 Oct 5-7 ^ |
58 |
36 |
* |
6 |
|
2000 Sep 28-30 ^ |
55 |
38 |
0 |
7 |
|
2000 Sep 15-17^ |
51 |
41 |
1 |
7 |
|
2000 Aug 18-19 |
60 |
34 |
* |
6 |
|
2000 Aug 4-5 |
67 |
28 |
* |
5 |
|
2000 Jul 25-26 |
63 |
31 |
* |
6 |
|
2000 Jul 14-16 |
64 |
29 |
* |
7 |
|
2000 Jun 23-25 |
60 |
31 |
0 |
9 |
|
2000 Jun 6-7 |
64 |
29 |
0 |
7 |
|
2000 Apr 28-30 |
61 |
33 |
* |
6 |
|
2000 Mar 10-12 |
63 |
32 |
* |
5 |
|
2000 Feb 25-27 |
57 |
35 |
1 |
7 |
|
2000 Feb 20-21 |
58 |
35 |
* |
7 |
|
2000 Feb 4-6 |
63 |
31 |
0 |
6 |
|
2000 Jan 17-19 |
66 |
26 |
* |
8 |
|
1999 Dec 9-12 |
68 |
25 |
1 |
6 |
|
1999 Oct 21-24 |
71 |
21 |
1 |
7 |
|
1999 Oct 8-10 |
70 |
25 |
1 |
4 |
|
1999 Sept 23-26 |
71 |
22 |
1 |
6 |
|
1999 Aug 16-18 |
68 |
21 |
1 |
10 |
|
1999 June 25-27 |
69 |
16 |
4 |
11 |
|
1999 Apr 13-14 |
73 |
15 |
3 |
9 |
|
1999 Feb 19-21 |
69 |
12 |
5 |
14 |
|
^ Based on Registered Voters |
||||
|
* Less than 0.5% |
||||
B. John Kerry
|
|
|
Never |
No |
||
|
% |
% |
% |
% |
||
|
2004 Jul 30-Aug 1 |
57 |
37 |
1 |
5 |
|
|
2004 Jul 19-21 |
55 |
37 |
2 |
6 |
|
|
2004 Jul 8-11 |
56 |
34 |
2 |
8 |
|
|
2004 Jun 21-23 |
58 |
35 |
2 |
5 |
|
|
2004 Apr 16-18 |
54 |
37 |
3 |
6 |
|
|
2004 Mar 26-28 |
53 |
36 |
3 |
8 |
|
|
2004 Feb 16-17 |
60 |
26 |
4 |
10 |
|
|
2004 Jan 29-Feb 1 |
61 |
23 |
6 |
10 |
|
|
2004 Jan 2-5 ^ |
31 |
32 |
19 |
18 |
|
|
2003 Nov 10-12 ^ |
31 |
24 |
26 |
19 |
|
|
2002 Dec 16-17 ^ |
31 |
13 |
32 |
24 |
|
|
1999 Feb 19-21 ^ |
30 |
9 |
39 |
22 |
|
|
^ |
WORDING: Massachusetts Senator John Kerry |
||||
C. John Edwards
|
|
|
Never |
No |
|
|
% |
% |
% |
% |
|
|
2004 Jul 30-Aug 1 |
59 |
27 |
3 |
11 |
|
2004 Jul 19-21 ^ |
52 |
26 |
5 |
17 |
|
2004 Jul 8-11 |
55 |
24 |
6 |
15 |
|
2004 Jan 29-Feb 1 |
54 |
21 |
10 |
15 |
|
2004 Jan 2-5 † |
24 |
24 |
27 |
25 |
|
2003 Nov 10-12 † |
22 |
18 |
37 |
23 |
|
^ Asked of a half sample |
||||
D. Teresa Heinz Kerry
|
Favorable |
Unfavorable |
Never heard of |
No opinion |
||
|
% |
% |
% |
% |
||
|
2004 Jul 30-Aug 1 |
42 |
31 |
12 |
15 |
|
|
2004 Jul 19-21 ^ |
31 |
19 |
23 |
27 |
|
|
2004 Apr 16-18 † |
23 |
16 |
28 |
33 |
|
|
^ |
Asked of a half sample |
||||
|
† |
WORDING: Teresa Heinz Kerry, wife of John Kerry |
||||
F. The Democratic Party
|
Favorable |
Unfavorable |
Never heard of |
No opinion |
||
|
% |
% |
% |
% |
||
|
2004 Jul 30-Aug 1 |
55 |
37 |
1 |
7 |
|
|
2004 Jul 19-21 ^ |
48 |
41 |
1 |
10 |
|
|
2004 Jan 29-Feb 1 |
59 |
34 |
* |
7 |
|
|
2004 Jan 2-5 |
47 |
44 |
* |
9 |
|
|
2003 Sep 8-10 |
49 |
45 |
-- |
6 |
|
|
2003 Mar 29-30 |
49 |
39 |
1 |
11 |
|
|
2003 Jan 3-5 |
52 |
36 |
1 |
11 |
|
|
2002 Dec 16-17 |
52 |
37 |
1 |
10 |
|
|
2002 Nov 8-10 |
48 |
42 |
0 |
10 |
|
|
2002 Oct 21-22 |
58 |
30 |
* |
12 |
|
|
2002 Sep 5-8 |
56 |
38 |
0 |
6 |
|
|
2002 Jul 26-28 |
55 |
34 |
* |
11 |
|
|
2002 Jan 11-14 |
55 |
33 |
* |
12 |
|
|
2001 Sep 7-10 |
56 |
38 |
* |
6 |
|
|
2000 Nov 13-15 |
53 |
38 |
1 |
8 |
|
|
2000 Aug 4-5 |
53 |
38 |
1 |
8 |
|
|
2000 Jul 25-26 |
56 |
35 |
* |
9 |
|
|
2000 Jan 7-10 |
61 |
33 |
* |
6 |
|
|
1999 Nov 18-21 |
51 |
41 |
* |
8 |
|
|
1999 Apr 30-May 2 |
53 |
37 |
1 |
9 |
|
|
1999 Feb 19-21 |
55 |
37 |
0 |
8 |
|
|
1999 Feb 12-13 |
56 |
38 |
* |
6 |
|
|
1999 Feb 4-8 |
57 |
37 |
* |
6 |
|
|
1999 Jan 8-10 |
57 |
35 |
* |
8 |
|
|
1998 Dec 19-20 |
57 |
30 |
* |
13 |
|
|
1998 Dec 15-16 |
58 |
32 |
2 |
8 |
|
|
1997 Oct 27-29 |
54 |
39 |
* |
7 |
|
|
1996 Aug 30-Sep 1 † |
60 |
36 |
* |
4 |
|
|
1996 Aug 16-18 † |
55 |
41 |
1 |
3 |
|
|
1996 Aug 5-7 † |
57 |
38 |
1 |
4 |
|
|
1996 Apr 9-10 |
55 |
38 |
0 |
7 |
|
|
1995 Apr 17-19 |
51 |
43 |
* |
6 |
|
|
1992 Jul 6-8 † |
54 |
38 |
* |
8 |
|
|
^ |
Asked of a half sample |
||||
|
† |
Based on registered voters |
||||
G. The Republican Party
|
Favorable |
Unfavorable |
Never heard of |
No opinion |
||
|
% |
% |
% |
% |
||
|
2004 Jul 30-Aug 1 |
47 |
45 |
1 |
7 |
|
|
2004 Jul 19-21 ^ |
50 |
43 |
* |
7 |
|
|
2004 Jan 29-Feb 1 |
48 |
45 |
* |
7 |
|
|
2004 Jan 2-5 |
52 |
40 |
1 |
7 |
|
|
2003 Sep 8-10 |
50 |
44 |
-- |
6 |
|
|
2003 Mar 29-30 |
56 |
33 |
1 |
10 |
|
|
2003 Jan 3-5 |
51 |
38 |
1 |
10 |
|
|
2002 Dec 16-17 |
51 |
38 |
1 |
10 |
|
|
2002 Nov 8-10 |
54 |
38 |
* |
8 |
|
|
2002 Oct 21-22 |
53 |
35 |
* |
12 |
|
|
2002 Sep 5-8 |
54 |
40 |
0 |
6 |
|
|
2002 Jul 26-28 |
55 |
36 |
* |
9 |
|
|
2002 Jan 11-14 |
61 |
30 |
* |
9 |
|
|
2001 Sep 7-10 |
47 |
48 |
* |
5 |
|
|
2000 Nov 13-15 |
49 |
43 |
* |
8 |
|
|
2000 Aug 4-5 |
54 |
37 |
1 |
8 |
|
|
2000 Jul 25-26 |
49 |
39 |
* |
12 |
|
|
2000 Jan 7-10 |
53 |
41 |
* |
6 |
|
|
1999 Nov 18-21 |
50 |
44 |
* |
6 |
|
|
1999 Apr 30-May 2 |
47 |
44 |
* |
9 |
|
|
1999 Feb 19-21 |
45 |
46 |
0 |
9 |
|
|
1999 Feb 12-13 |
40 |
54 |
1 |
5 |
|
|
1999 Feb 4-8 |
45 |
47 |
* |
8 |
|
|
1999 Jan 8-10 |
40 |
52 |
* |
8 |
|
|
1998 Dec 19-20 |
31 |
57 |
* |
12 |
|
|
1998 Dec 15-16 |
43 |
47 |
2 |
8 |
|
|
1997 Oct 27-29 |
50 |
42 |
* |
8 |
|
|
1996 Aug 30-Sep 1 † |
50 |
45 |
* |
5 |
|
|
1996 Aug 16-18 † |
55 |
41 |
1 |
2 |
|
|
1996 Aug 5-7 † |
51 |
44 |
* |
5 |
|
|
1996 Apr 9-10 |
52 |
41 |
* |
7 |
|
|
1995 Apr 17-19 |
52 |
42 |
* |
6 |
|
|
1992 Jul 6-8 † |
53 |
39 |
* |
8 |
|
|
^ |
Asked of a half sample |
||||
|
† |
Based on registered voters |
||||