PRINCETON, NJ -- Opponents of legalizing same-sex marriage continue to outnumber supporters in the United States, by 53% to 44%. However, opposition is now tied for the lowest Gallup has measured. Support was slightly higher, at 46%, in 2007.
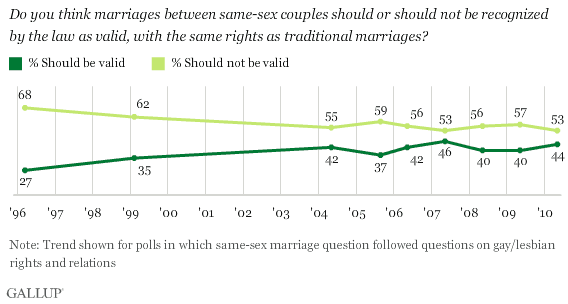
These results are based on Gallup's Values and Beliefs Poll, which has tracked attitudes toward legal same-sex marriage annually since 2004. When Gallup first asked about the legality of gay marriage in a 1996 poll, 68% of Americans were opposed and 27% in favor.
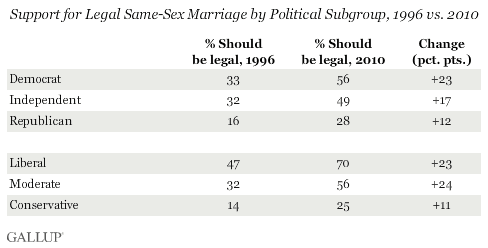
Since that time, support has increased among the major political and ideological subgroups, though more among those on the left of the political spectrum than among those on the right. Currently, a majority of Democrats favor legal gay marriage, as do a majority of moderates and liberals, with liberals the most supportive of these groups, at 70%.
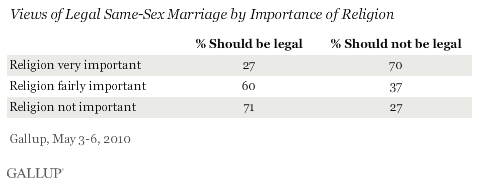
These political differences in support for gay marriage may stem from even larger differences by religion. Americans who say religion is "very important" in their lives oppose legal same-sex marriage by 70% to 27%. In contrast, Americans who say religion is not important to them support gay marriage by just as wide a margin.
Differences on the issue are also apparent by religious affiliation. Notably, 81% of Americans who claim no religious affiliation favor legal same-sex marriage. That compares to 48% support among Catholics and 33% among Protestants (including those who identify as Christian but do not specify a particular Christian denomination).
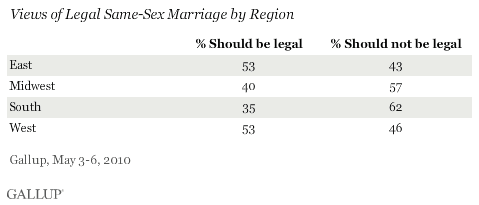
The May 3-6 poll data also reveal interesting regional differences, with a majority of Eastern and Western residents in favor of gay marriage, and roughly 6 in 10 Midwestern and Southern residents opposed.
Currently, gay marriage is legal in the District of Columbia and five states, almost all of which are in the Northeast (Vermont, Connecticut, New Hampshire, and Massachusetts; Iowa is the other state).
Bottom Line
Over time, Americans have become more accepting of legal same-sex marriage, and a growing number of subgroups now show majority support for it. However, religious and conservative segments of the U.S. population remain largely opposed -- even though their support for gay marriage has also increased in recent years. Because religious and conservative groups are larger than nonreligious and left-leaning groups in the United States, overall, more Americans remain opposed to, rather than in favor of, same-sex marriage.
Survey Methods
Results are based on telephone interviews conducted May 3-6, 2010, with a random sample of 1,029 adults, aged 18 and older, living in the continental U.S., selected using a random-digit-dial sampling technique.
For results based on the total sample of national adults, one can say with 95% confidence that the margin of error is ±4 percentage points.
Interviews are conducted with respondents on landline telephones (for respondents with a landline telephone) and cellular phones (for respondents who are cell phone only). Each sample includes a minimum quota of 150 cell phone only respondents and 850 landline respondents, with additional minimum quotas among landline respondents for gender within region. Landline respondents are chosen at random within each household on the basis of which member had the most recent birthday.
Samples are weighted on the basis of gender, age, race, education, region and phone lines. Demographic weighting targets are based on the March 2009 Current Population Survey figures for the aged 18 and older non-institutionalized population living in continental U.S. telephone households. All reported margins of sampling error include the computed design effects for weighting and sample design.
In addition to sampling error, question wording and practical difficulties in conducting surveys can introduce error or bias into the findings of public opinion polls.
View methodology, full question results, and trend data.