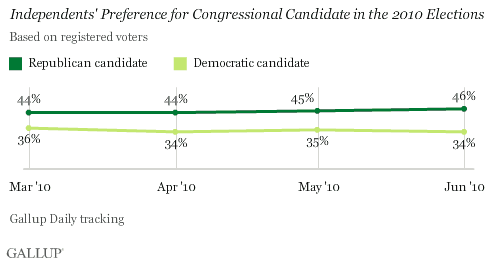
PRINCETON, NJ -- By an average 10 percentage-point margin since March, 45% to 35%, independent registered voters have consistently preferred the Republican to the Democrat when asked which congressional candidate they would vote for in their district. Independents' preference for Republicans has been generally consistent over this time, with the gap in favor of Republicans increasing slightly since March, from 8 to 12 points.
Currently about one in five independent registered voters are undecided or prefer a candidate from outside the two major parties, suggesting the potential for movement in these numbers between now and Election Day.
These data are based on monthly averages of Gallup Daily tracking, including interviews with more than 6,000 registered voters each month.
Typically, Republican and Democratic identifiers show a high degree of loyalty to their party's candidate in voting for Congress. Since March, an average of 92% of Democrats and 94% of Republicans have said they would vote for their party's candidate if the election were held today.
As such, the voting preferences of independents are a key component in determining overall preferences leading up to Election Day, and the eventual outcome of the election. Another key component is turnout, which tends to be highest among Republican identifiers and lowest among independents.
Overall, Gallup's generic ballot has shown a virtual tie among all registered voters since March, with an average of 46% saying they would vote Republican and 45% Democratic. The Democratic Party remains competitive with the GOP despite the independent tilt toward the Republican Party because more registered voters identify as Democrats (35%) than as Republicans (31%) in the March-June data.
The Role of President Obama
Though the president is not on the ballot in midterm election years, he certainly is a major factor in many voters' vote decisions, as evidenced by the typical pattern in which the president's party loses congressional seats in midterms. Evaluations of the president could be especially important among independents, whose congressional voting preferences are not anchored by party loyalty.
At this point, dissatisfaction with Obama appears to be a reason independents favor the Republican Party this year. Since March, 42% of independent registered voters, on average, have approved of the job Obama is doing as president, while 51% have disapproved. (This is a slightly more negative assessment than is true for all independents, among whom 44% approve and 45% disapprove of Obama.)
Independent voters who disapprove of Obama's job performance say by 71% to 12% that they would vote for the Republican candidate in their district if the election were held today. In contrast, independent voters who approve of Obama favor the Democratic candidate, but by a smaller 63% to 17% margin.
The vote patterns of independent approvers and disapprovers have been stable from month to month.
Bottom Line
A key to winning elections for the Democratic and Republican Parties is to appeal to independent voters. Thus far in the 2010 election campaign, Republicans have attracted greater support from independents than have Democrats. This may in part be the result of independent voters' greater dissatisfaction than satisfaction with the job President Obama is doing.
Independents' preference for the Republican congressional candidate in their district has been consistent this year. Still, one in five independents remain undecided. The preferences of these voters, as well as which independents turn out on Election Day, will have a major impact on the direction and magnitude of seat change in the midterm elections.
Survey Methods
Results are based on telephone interviews conducted as part of Gallup Daily tracking June 1-28, 2010, with a random sample of 6,398 registered voters, aged 18 and older, living in all 50 U.S. states and the District of Columbia, selected using random-digit-dial sampling.
For results based on the total sample of national adults, one can say with 95% confidence that the maximum margin of sampling error is ±1 percentage point.
For results based on the total sample of 1,982 independent registered voters, one can say with 95% confidence that the maximum margin of sampling error is ±3 percentage points.
Interviews are conducted with respondents on landline telephones and cellular phones, with interviews conducted in Spanish for respondents who are primarily Spanish-speaking. Each daily sample includes a minimum quota of 150 cell phone respondents and 850 landline respondents, with additional minimum quotas among landline respondents for gender within region. Landline respondents are chosen at random within each household on the basis of which member had the most recent birthday.
Samples are weighted by gender, age, race, Hispanic ethnicity, education, region, adults in the household, cell phone-only status, cell phone-mostly status, and phone lines. Demographic weighting targets are based on the March 2009 Current Population Survey figures for the aged 18 and older non-institutionalized population living in U.S. telephone households. All reported margins of sampling error include the computed design effects for weighting and sample design.
The 2010 voting questions are asked of approximately one-quarter of the sample each day.
In addition to sampling error, question wording and practical difficulties in conducting surveys can introduce error or bias into the findings of public opinion polls.
For more details on Gallup's polling methodology, visit www.gallup.com.