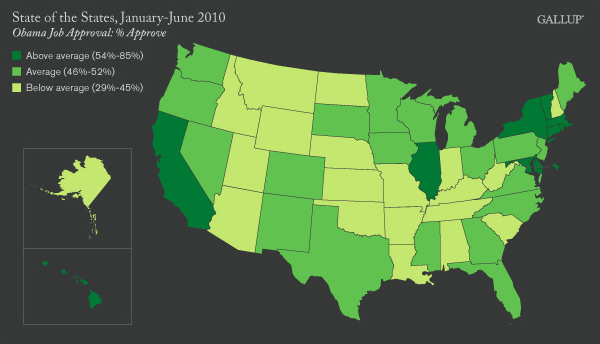
PRINCETON, NJ -- During the first half of 2010, residents of Hawaii and the District of Columbia were most likely to approve of the job Barack Obama is doing as president. His lowest approval ratings came from Wyoming residents. All told, there is a 56 percentage-point gap between Obama's highest and lowest state ratings.
In general, Obama's greatest support is concentrated in the Northeast and Mid-Atlantic, including his current home (District of Columbia), but his past homes (Illinois and Hawaii) also rank among the top 10. Many of his lower approval ratings come from Mountain West and Southern states. New Hampshire stands apart from its Northeastern neighbors in giving Obama one of his lowest state job approval ratings.
These results are based on aggregated data from January-June 2010 Gallup Daily tracking, and includes interviews with more than 90,000 adults nationwide, including all 50 states and the District of Columbia. Each state's data are weighted to ensure they are representative of the adult population for that state, in terms of demographic characteristics.
Obama averaged 49% job approval on a nationwide basis in the first half of the year. He received at least 50% approval in 15 states and the District of Columbia, including four states with 60% or more approval. In nine states, his average approval rating was 40% or below. (See Page 2 for full data on each state.)
Obama's job approval has trended down since he took office -- his 49% nationwide approval average in the first half of 2010 compares with a 57% average for all of 2009. So far in 2010, his average approval ratings are down from the full 2009 averages in all states except Delaware, where the rating is similar (61% in 2009 and 62% thus far in 2010).
In general, the highest- and lowest-approving states for Obama in the first half of 2010 are similar to those for all of 2009. In 2009, his highest approval ratings were in the District of Columbia, Hawaii, and Maryland, and his lowest in Wyoming, Idaho, West Virginia, and Alaska.
This story is the first in a series of midyear updates on Gallup's State of the States data, to be released in July and August on Gallup.com.
Gallup.com will report new full-year totals in early 2011 based on all 2010 surveys.
Results are based on telephone interviews conducted as part of Gallup Daily tracking Jan. 2-June 30, 2010, with a random sample of 90,941 adults, aged 18 and older, living in all 50 U.S. states and the District of Columbia, selected using random-digit-dial sampling.
For results based on the total sample of national adults, one can say with 95% confidence that the maximum margin of sampling error is ±1 percentage point.
Margins of sampling error for individual states are higher. Most states have a margin of error of ±3 percentage points or less, though margins of error are as high as ±9 percentage points in the District of Columbia and ±8 points in Wyoming, Hawaii, and North Dakota.
Interviews are conducted with respondents on landline telephones and cellular phones, with interviews conducted in Spanish for respondents who are primarily Spanish-speaking. Each daily sample includes a minimum quota of 150 cell phone respondents and 850 landline respondents, with additional minimum quotas among landline respondents for gender within region. Landline respondents are chosen at random within each household on the basis of which member had the most recent birthday.
Samples are weighted by gender, age, race, Hispanic ethnicity, education, region, adults in the household, cell phone-only status, cell phone-mostly status, and phone lines. Demographic weighting targets are based on the March 2009 Current Population Survey figures for the aged 18 and older non-institutionalized population living in U.S. telephone households. All reported margins of sampling error include the computed design effects for weighting and sample design.
In addition to sampling error, question wording and practical difficulties in conducting surveys can introduce error or bias into the findings of public opinion polls.
For more details on Gallup's polling methodology, visit www.gallup.com.