PRINCETON, NJ -- Underemployment, as measured by Gallup, is 18.3% in mid-August, essentially unchanged since the end of June. Underemployment peaked at 20.4% in April but has not been able to break below its current level this year.

Gallup's underemployment measure estimates the percentages of American workers who are either unemployed or working part time but wanting full-time work. It is based on more than 15,000 phone interviews with U.S. adults aged 18 and older in the workforce, collected over a 30-day period and reported daily and weekly. Gallup's results are not seasonally adjusted and tend to be a precursor of government reports by approximately two weeks.
Unemployment Up; Part-Time Employees Wanting Full-Time Work Down
The percentage of employees working part time but wanting full-time work declined slightly in mid-August to 9.2% from 9.5% at the end of July -- returning to its late June and mid-July level. This drop was largely offset by a slight uptick to 9.1% in the unemployment rate component of Gallup's underemployment measure.

Among subgroups in the U.S. workforce, Gallup finds:
-
A higher percentage of women than of men are underemployed.
-
Americans aged 18 to 29 continue to have the highest underemployment rate of any age group, at 27.6% in mid-August, including 11.9% unemployed and 15.7% employed part time but wanting full-time work.
-
Workers without any college education remain more likely to be underemployed than do those with higher education levels.
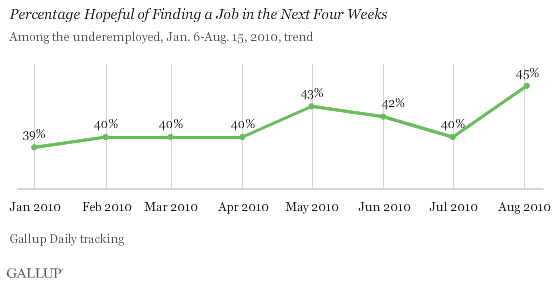
Job Hope Hits New 2010 High
Forty-five percent of underemployed Americans are "hopeful" in mid-August that they will be able to find a job in the next four weeks -- the highest level of 2010.

Job Market Conditions Affect More Than the Underemployed
It is encouraging that more of the underemployed are "hopeful" of finding a job now than has been true at any other time this year -- and something job hunters should keep in mind in this difficult job market. Additionally, Gallup's Job Creation Index shows that some employers are continuing to hire, although their hiring appears to be having little impact on overall underemployment this summer. To some degree, these new job gains are being offset by job losses. Further, this is the season for hiring, meaning more jobs may be available than the seasonally adjusted economic data reported by the government might imply.
Regardless, Gallup data also show that today's dismal job market conditions are having a major psychological impact on Americans who are currently employed -- not just the 18.3% underemployed.
-
26% of employed Americans are worried about being laid off
-
26% are worried their wages will be reduced
-
25% think their hours will be cut, and
-
39% fear their benefits will be reduced
While these percentages are down slightly from last year's peaks, they probably explain why so many Americans continue to say they are cutting back on their spending. They also show why so many small-business owners are worried about their revenues and cash flows in the months ahead.
Getting Americans back to work is essential, not only to help the underemployed, but also to reduce the job fears of all Americans -- and get the American consumer spending once more.
Gallup Daily tracking will provide continuous monitoring of the jobs situation in the weeks and months ahead.
Gallup.com reports results from these indexes in daily, weekly, and monthly averages and in Gallup.com stories. Complete trend data are always available to view and export in the following charts:
Daily: Employment, Economic Confidence and Job Creation, Consumer Spending
Weekly: Employment, Economic Confidence, Job Creation, Consumer Spending
Read more about Gallup's economic measures.
Results are based on telephone interviews conducted as part of Gallup Daily tracking survey July 17-Aug. 15, 2010, with a random sample of 17,868 adults, aged 18 and older, living in all 50 U.S. states and the District of Columbia, selected using random-digit-dial sampling.
For results based on the total sample of national adults, one can say with 95% confidence that the maximum margin of sampling error is ±1 percentage point.
Interviews are conducted with respondents on landline telephones and cellular phones, with interviews conducted in Spanish for respondents who are primarily Spanish-speaking. Each daily sample includes a minimum quota of 150 cell phone respondents and 850 landline respondents, with additional minimum quotas among landline respondents for gender within region. Landline respondents are chosen at random within each household on the basis of which member had the most recent birthday.
Samples are weighted by gender, age, race, Hispanic ethnicity, education, region, adults in the household, cell phone-only status, cell phone-mostly status, and phone lines. Demographic weighting targets are based on the March 2009 Current Population Survey figures for the aged 18 and older non-institutionalized population living in U.S. telephone households. All reported margins of sampling error include the computed design effects for weighting and sample design.
In addition to sampling error, question wording and practical difficulties in conducting surveys can introduce error or bias into the findings of public opinion polls.
For more details on Gallup's polling methodology, visit www.gallup.com.
