WASHINGTON, D.C. -- Gallup-Healthways Well-Being Index data document the severity of health disparities between low- and high-income Americans. Those making less than $24,000 per year suffer from much lower emotional and physical health, have poorer health habits, and have significantly less access to medical care -- all of which combine to drag down their overall Well-Being Index score.
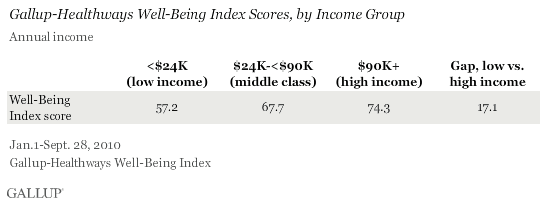
At a time when more people are facing financial hardships as a result of the recession, Gallup finds a Well-Being Index composite score of 57.2 among those making less than $24,000 per year, which compares negatively with the 67.7 score among the middle class and the 74.3 score among high-income Americans. The scores reflect 55 individual items that collectively measure Americans' physical, emotional, and fiscal well-being. For more information on the Gallup-Healthways Well-Being Index, see page 2.
Gallup's analysis of health disparities across incomes is based on more than 200,000 surveys of American adults collected Jan. 1-Sept. 28, 2010. Even when controlling for age, which is related to well-being, the Well-Being Index reveals that low-income Americans face more emotional and physical health problems, engage in fewer healthy behaviors, and have less access to basic medical care. Gallup controlled for age and found that within each age group, the same pattern of well-being income differences exists.
Physical Health Problems More Prevalent Among Low-Income Americans
Low-income Americans are more likely than their high-income counterparts to say they have been diagnosed with each of the chronic conditions Gallup asks about. The differences are largest for depression, high blood pressure, and diabetes, with gaps of 18.7, 12.8, and 9.4 percentage points, respectively. The high level of obesity among low-income Americans -- 32% are obese versus 21.7% of those with high incomes -- is likely a contributing factor in these differences.
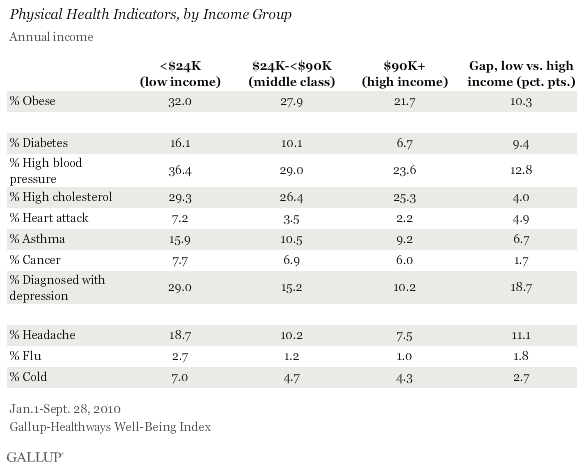
Reports of colds and flu are also more common, and headaches are more than twice as likely among the low-income group as among high-income Americans.
Low-Income Americans Exercise Less, Eat Less Healthily, and Smoke More
Healthy habits are strongly connected to physical health, and low-income Americans are less likely to practice healthy behaviors, underscoring the interconnectedness of different aspects of well-being. Low-income Americans are less likely to report healthy eating and frequent exercise compared with those with higher incomes. Smoking is nearly three times as common among low-income as among high-income Americans.
Access to Care Lacking for Low-Income Americans
Low-income Americans face a "chicken-and-egg" problem: Preventive care, effective treatment, and health education could all help improve their health and well-being, but they are the group that can least afford and has the poorest access to basic health services.
One-third of low-income Americans are uninsured, and more than that say there have been times in the past 12 months when they didn't have enough money for healthcare. About 7 in 10 have a personal doctor, and less than half (44.3%) say they have visited a dentist in the past 12 months. By comparison, more than 8 in 10 high-income Americans have a personal doctor and have visited a dentist.
Low-Income Americans Experience Fewer Positive Emotions, More Negative Ones
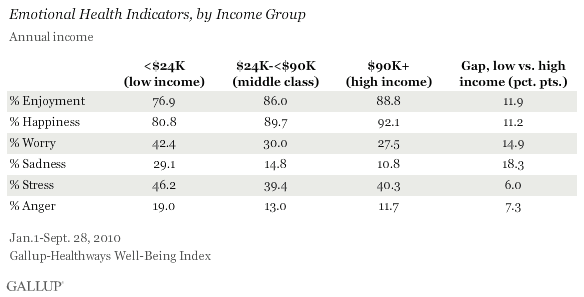
In addition to -- or perhaps because of -- worse physical health, healthy habits, and healthcare access, low-income Americans' daily emotional experience is not as good compared with those who have higher incomes.
Low-income Americans are less likely to experience enjoyment and happiness compared with those in the middle-class and high-income groups and are much more likely to experience worry, sadness, stress, and anger. The gap between the low- and high-income groups ranges from 6 points on stress to 18.3 points on sadness.
Gallup asks Americans if they experienced each of these feelings during "a lot of the day yesterday" to gauge their daily emotional experiences.
Bottom Line
Although long documented and well-known, income disparities in health status persist, and according to the Gallup-Healthways Well-Being Index data, are severe and expansive in 2010. The Well-Being Index, through its comprehensive set of questions, provides a complete picture of Americans' health and gives insight into the interplay of the various aspects of well-being.
These findings reveal that low-income Americans suffer in a negative health feedback cycle -- they have poor health habits and high levels of physical illness, lack access to preventive care and treatment, and live with heightened emotional negativity. While the data cannot determine direct cause and effect, they do show that relationships are present among these different areas of well-being. Recent research by Gallup senior scientists Arthur Stone, Daniel Kahneman, and Angus Deaton found, separately, that cold and flu rates decrease as income increases, and that earning more money -- up to a $75,000-a-year threshold -- can increase happiness.
The new healthcare law seeks to reduce income-related disparities in health outcomes on several different levels. Separate provisions will expand healthcare coverage and make it more affordable to more Americans, require insurance plans to provide preventive services at little or no cost, and infuse billions into new public health programs. These programs will be rolled out over time, and therefore, it could be years before these new provisions would begin to have a measurable impact on low-income Americans' well-being.
Leaders interested in improving the well-being of the poorest Americans, however, may need to take more immediate action. According to the Census Bureau, the U.S. poverty rate rose to 14.3% in 2009, the highest level since 1994. The number of food stamp recipients is also increasing -- there were 41.8 million in July of this year, up from 39.4 million in January -- meaning more people lack excess money to spend on healthy foods, one key to controlling weight and disease. If these figures continue to rise, the number of Americans with poor health will also grow, as long as the disparities found in this analysis remain.
About the Gallup-Healthways Well-Being Index
The Gallup-Healthways Well-Being Index tracks U.S. well-being and provides best-in-class solutions for a healthier world. To learn more, please visit well-beingindex.com.
Results are based on telephone interviews conducted as part of the Gallup-Healthways Well-Being Index survey Jan. 1-Sept. 28, 2010, with a random sample of 265,314 adults, aged 18 and older, living in all 50 U.S. states and the District of Columbia, selected using random-digit-dial sampling.
Surveys were conducted with 44,309 adults in the less than $24,000 annual income bracket, 106,298 adults in the $24,000 to less than $90,000 annual income bracket, and 45,154 adults in the $90,000 or more annual income bracket.
For results based on the total sample of national adults, one can say with 95% confidence that the maximum margin of sampling error is ±1 percentage point.
Interviews are conducted with respondents on landline telephones and cellular phones, with interviews conducted in Spanish for respondents who are primarily Spanish-speaking. Each daily sample includes a minimum quota of 150 cell phone respondents and 850 landline respondents, with additional minimum quotas among landline respondents for gender within region. Landline respondents are chosen at random within each household on the basis of which member had the most recent birthday.
Samples are weighted by gender, age, race, Hispanic ethnicity, education, region, adults in the household, cell phone-only status, cell phone-mostly status, and phone lines. Demographic weighting targets are based on the March 2009 Current Population Survey figures for the aged 18 and older non-institutionalized population living in U.S. telephone households. All reported margins of sampling error include the computed design effects for weighting and sample design.
In addition to sampling error, question wording and practical difficulties in conducting surveys can introduce error or bias into the findings of public opinion polls.
For more details on Gallup's polling methodology, visit https://www.gallup.com/.
