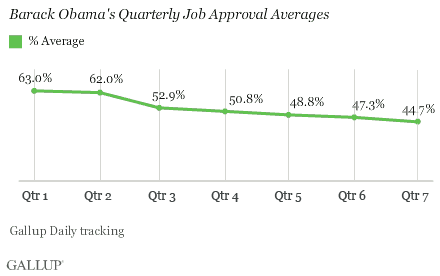
PRINCETON, NJ -- Barack Obama averaged 44.7% job approval during the seventh quarter of his presidency. His average approval rating has declined each quarter since he took office, falling by more than two percentage points in the most recent quarter to establish a new low.

These results are based on Gallup Daily tracking surveys conducted from July 20-Oct. 19, including interviews with more than 90,000 Americans. The seventh quarter included Obama's new low three-day average approval rating of 41% in mid-August. His approval rating has recovered somewhat since then, with his latest three-day average at 46% for Oct. 17-19 interviewing.
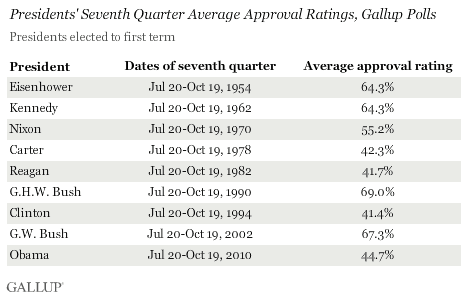
Obama's seventh-quarter average ranks on the low end of comparable averages among the nine presidents since Eisenhower, although it is similar to that of several of the more recently elected presidents, including Jimmy Carter, Ronald Reagan, and Bill Clinton.

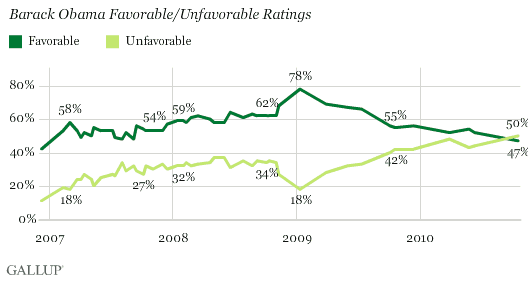
Obama's decreased popularity is also evident in his favorable rating, updated in an Oct. 14-17 Gallup poll. For the first time, more Americans view the president unfavorably (50%) than favorably (47%), and his favorable rating is the lowest of his presidency.

His all-time low favorable rating of 42% came in Gallup's initial measurement of Obama in December 2006, at which time 47% did not know enough about him to give an opinion and 11% viewed him unfavorably. As he became more well-known over the course of the 2008 presidential campaign his favorable rating gradually rose and hit a high of 78% in January 2009 just prior to his taking office. Since his inauguration, positive opinions of him have declined by 31 points.
The Oct. 14-17 Gallup poll also finds that, at this point in his presidency, 39% of Americans believe Obama deserves re-election and 54% say he does not. Earlier this year, between 46% and 48% of Americans said Obama should be re-elected.
The current results for Obama are remarkably similar to what Gallup measured for Clinton in October 1994, at which time 38% of Americans thought he was worthy of a second term as president and 57% disagreed. That was just before Clinton's party lost its congressional majority in the 1994 elections, but two years later voters re-elected Clinton by a comfortable margin.
By comparison, in September 2002, 62% of Americans thought George W. Bush deserved re-election. Two years after his party's strong showing in the 2002 midterms, Bush won a narrow victory over John Kerry in the 2004 presidential election.
Implications
With the midterm elections less than two weeks away, Obama's diminished public support means the Democratic Party is vulnerable to heavy losses in Congress. The president's party has lost an average of 36 U.S. House seats when his approval rating is below 50%.
However, both Clinton and Reagan were in similar poor standing at this point in their presidencies, and both recovered in time to win second terms as president.
Explore Obama's approval ratings in depth and compare them with those of past presidents in the Gallup Presidential Job Approval Center.
Survey Methods
Results for President Obama's approval rating are based on telephone interviews conducted as part of Gallup Daily tracking July 20-Oct. 19, 2010, with a random sample of 91,762 adults, aged 18 and older, living in all 50 U.S. states and the District of Columbia, selected using random-digit-dial sampling.
For results based on the total sample of national adults, one can say with 95% confidence that the maximum margin of sampling error is ±1 percentage point.
Interviews are conducted with respondents on landline telephones and cellular phones, with interviews conducted in Spanish for respondents who are primarily Spanish-speaking. Each daily sample includes a minimum quota of 150 cell phone respondents and 850 landline respondents, with additional minimum quotas among landline respondents for gender within region. Landline respondents are chosen at random within each household on the basis of which member had the most recent birthday.
Samples are weighted by gender, age, race, Hispanic ethnicity, education, region, adults in the household, cell-phone-only status, cell-phone-mostly status, and phone lines. Demographic weighting targets are based on the March 2009 Current Population Survey figures for the aged 18 and older non-institutionalized population living in U.S. telephone households. All reported margins of sampling error include the computed design effects for weighting and sample design.
---
Results for the favorable and deserves re-election ratings are based on telephone interviews conducted Oct. 14-17, 2010 with a random sample of 1,029 adults, aged 18 and older, living in the continental U.S., selected using random-digit-dial sampling.
For results based on the total sample of national adults, one can say with 95% confidence that the maximum margin of sampling error is ±4 percentage points.
Interviews are conducted with respondents on landline telephones (for respondents with a landline telephone) and cellular phones (for respondents who are cell phone only). Each sample includes a minimum quota of 150 cell-phone-only respondents and 850 landline respondents, with additional minimum quotas among landline respondents for gender within region. Landline respondents are chosen at random within each household on the basis of which member had the most recent birthday.
Samples are weighted by gender, age, race, education, region, and phone lines. Demographic weighting targets are based on the March 2009 Current Population Survey figures for the aged 18 and older non-institutionalized population living in continental U.S. telephone households. All reported margins of sampling error include the computed design effects for weighting and sample design.
In addition to sampling error, question wording and practical difficulties in conducting surveys can introduce error or bias into the findings of public opinion polls.
View methodology, full question results, and trend data.
For more details on Gallup's polling methodology, visit https://www.gallup.com/.
