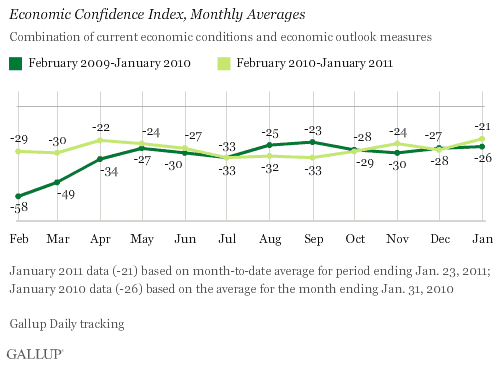
PRINCETON, NJ -- Gallup's Economic Confidence Index improved to an average of -21 in Gallup Daily tracking so far in January, up from -28 in December. If these optimism levels continue through the end of the month, January 2011 will have the most positive economic confidence score since Gallup began daily measurement in January 2008.

Optimism among upper-income Americans is increasing faster than that of their lower- and middle-income counterparts. Gallup's Economic Confidence Index among upper-income Americans (those making $90,000 or more annually) has averaged -7 so far in January -- a sharp improvement from -18 in December, and better than the -18 in January 2010. Lower-and middle-income Americans' confidence shows a similar, if more modest, improvement: to -24 thus far in January, from -30 in December and -27 in January 2010.

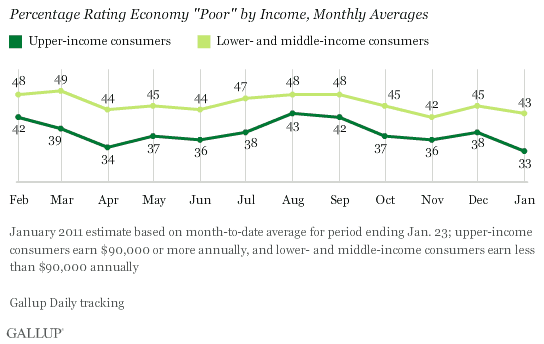
Gallup's Economic Confidence Index consists of two measures, both of which show improvement: one gauging Americans' perceptions of current economic conditions and the other, their economic outlook. In January to date, 42% of Americans rate current economic conditions "poor" -- a slight improvement from 44% in December and 45% in January 2010. Consumers' assessments of current economic conditions improved slightly more among upper-income than among lower- and middle-income Americans (those making less than $90,000 annually).

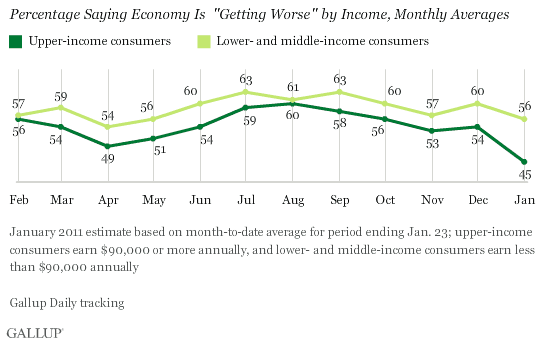
Upper-income Americans, as is typical, are less likely to say economic conditions are "getting worse" than are lower- and middle-income Americans. So far in January, 45% of upper-income Americans and 56% of lower- and middle-income consumers say this.

The percentage of upper-income Americans (50%) in January who say economic conditions are "getting better" is higher than the percentage who say things are getting worse, for the first time since September 2009, and the second time in the three years of Gallup Daily tracking.
Commentary
Gallup's Economic Confidence Index shows that consumers are more optimistic about the economy in January than they have been in three years. It may be that the start of a new year, the more cooperative tone in Washington, the continued gains on Wall Street, the Federal Reserve's continuing efforts to stimulate the economy, and the extension of the Bush tax cuts late last year have combined to make all Americans -- and particularly upper-income Americans -- more optimistic about the U.S. economy. Confidence is also up despite fears of continued financial problems in Europe, inflation problems in Asia, and state and local financial problems as well as housing issues in the U.S.
Gallup Daily tracking also suggests that the Conference Board will report an increase in consumer confidence on Tuesday morning. On the other hand, because of its composition of economic measures, the Reuters/University of Michigan Consumer Sentiment Index on Friday may not fully correct itself from its early January reading showing a decline in confidence.
Although overall economic confidence remains low as reflected by its negative score, its improved January status also provides a somewhat more positive setting for President Obama's State of the Union address Tuesday. Improved economic perceptions may not only explain, at least in part, the recent increase in the president's approval rating, but may also make Americans more receptive to any new actions he puts forth, particularly if they have bipartisan support.
Still, creating jobs and balancing the federal budget continue to be among the major challenges facing the nation. Slightly improved economic confidence can help set the stage for a successful effort to aggressively stimulate private-sector job growth and aggressively cut federal spending, but it will take a lot more to actually turn these priorities into realities.
Gallup.com reports results from these indexes in daily, weekly, and monthly averages and in Gallup.com stories. Complete trend data are always available to view and export in the following charts:
Daily: Employment, Economic Confidence and Job Creation, Consumer Spending
Weekly: Employment, Economic Confidence, Job Creation, Consumer Spending
Read more about Gallup's economic measures.
View our economic release schedule.
Survey Methods
Results are based on telephone interviews conducted as part of Gallup Daily tracking during the month of January 2011, for the month-to-date ending Jan. 23, with 8,755 respondents, aged 18 and older, living in all 50 U.S. states and the District of Columbia, selected using random-digit-dial sampling.
For results based on the total weekly sample of national adults, one can say with 95% confidence that the maximum margin of sampling error is ±2 percentage points. For results based on the total monthly sample of more than 15,000 national adults, one can say with 95% confidence that the maximum margin of sampling error is ±1 percentage point.
Interviews are conducted with respondents on landline telephones and cellular phones, with interviews conducted in Spanish for respondents who are primarily Spanish-speaking. Each daily sample includes a minimum quota of 200 cell phone respondents and 800 landline respondents, with additional minimum quotas among landline respondents for gender within region. Landline respondents are chosen at random within each household on the basis of which member had the most recent birthday.
Samples are weighted by gender, age, race, Hispanic ethnicity, education, region, adults in the household, cell phone-only status, cell phone-mostly status, and phone lines. Demographic weighting targets are based on the March 2010 Current Population Survey figures for the aged 18 and older non-institutionalized population living in U.S. telephone households. All reported margins of sampling error include the computed design effects for weighting and sample design.
In addition to sampling error, question wording and practical difficulties in conducting surveys can introduce error or bias into the findings of public opinion polls.
For more details on Gallup's polling methodology, visit www.gallup.com.
