PRINCETON, NJ -- Gallup's analysis of party affiliation in the U.S. states shows a marked decline in the number of solidly Democratic states from 2008 (30) to 2010 (14). The number of politically competitive states increased over the same period, from 10 to 18, with more limited growth in the number of leaning or solidly Republican states.
Even with Democratic Party affiliation declining during the past two years, Democratic states still outnumbered Republican states by 23 to 10 last year, and there were 14 solidly Democratic states compared with 5 solidly Republican states.
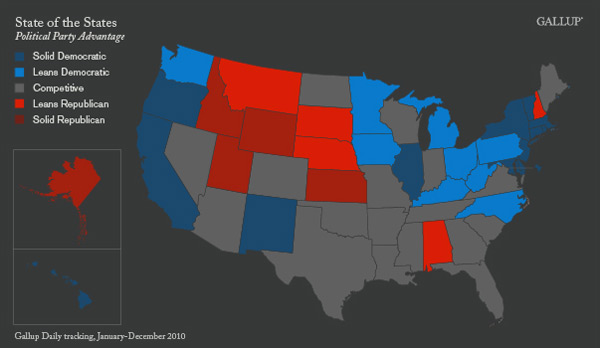
Still, the political map this year looks very different from the Democratic-dominated map in 2008.
 |
| Explore complete state data > |
Looking more closely at the changes in state party affiliation since 2008, only one state moved from a Democratic positioning to a Republican positioning -- New Hampshire, which was solidly Democratic in 2008 but now is considered leaning Republican. Alabama, Kansas, Montana, and South Dakota moved from a competitive designation to solidly or leaning Republican status. A total of 12 states -- Arkansas, Colorado, Florida, Indiana, Louisiana, Maine, Missouri, Nevada, Oklahoma, Tennessee, Virginia, and Wisconsin -- shifted from solidly or leaning Democratic to competitive. No states have moved in a more Democratic direction since 2008. (A listing of each state's classification for 2008, 2009, and 2010 is available on page 2 of this report.)
Gallup has documented the decline in Democratic Party affiliation at the national level from its recent peak in 2008 and early 2009. After several years of increasing Democratic affiliation beginning in late 2005, the current political situation is similar to what it was in the mid-2000s, when the parties were more or less even.
In fact, every state and the District of Columbia had fewer residents identifying as Democrats, or identifying as independents but leaning Democratic, in 2010 than in 2008. The greatest declines were in Rhode Island, New Hampshire, Maine, and Hawaii; the smallest were in North Dakota and Mississippi.
These results are based on Gallup Daily tracking, and include interviews with more than 350,000 Americans each year since 2008. In 2010, Gallup interviewed at least 1,000 adults in every state but North Dakota as well as the District of Columbia.
All respondents are asked whether they identify as Democrats, Republicans, or independents. Those who say they are independents or who express no party preference are asked whether they "lean" more to the Republican Party or the Democratic Party.
The data reported here for party affiliation take into account both party identification and leaning. This allows for a better comparison of party strength across states, given that the percentage of independents varies widely -- from a low of 28% in Kentucky in 2010 to a high of 58% in Rhode Island. Many of the states with higher proportions of independents are dominated electorally by one party, so leaned party identification gives a better sense of the true political orientation of each state. The full 2010 party affiliation data for each state are available on page 3.
The state classifications do not necessarily indicate how each state would vote in a given election, because the results are based on all state residents rather than the smaller voting electorate in each state. Usually, Democratic affiliation is higher in the general population than in the electorate, given generally higher rates of voter participation by Republicans.
Wyoming, Utah Most Republican; D.C. and Several States Most Democratic
In addition to the District of Columbia, the most solidly Democratic states are Maryland, Massachusetts, Vermont, and Hawaii, all showing at least 20-percentage-point advantages for the Democratic Party in the party preferences of their state residents. The most solidly Republican states are Wyoming, Utah, and Idaho, with at least 20-point Republican advantages.
In general, New England and Middle Atlantic states make up most of the 10 most Democratic states. Most of the top 10 Republican states are from the Mountain West or Plains regions.
Wyoming, Utah, Idaho, and Alaska have been the four most Republican states in each of the last three years, with Utah topping the list in 2008 and Wyoming in 2009 and 2010.
Apart from the District of Columbia, Rhode Island ranked as the most Democratic state in 2008 and 2009, but is tied for sixth this year after showing one of the steepest declines in Democratic affiliation. Maryland has been in the top 10 each year but has moved steadily up the list, from eighth in 2008 to fourth in 2009 to second in 2010.
Implications
The United States, both nationally and in every state, has moved in a more Republican direction during the last two years. Though the losses are not welcome news for the Democratic Party, the decline since 2008 is from a high point in the party's support, the highest in at least two decades. Thus, while the losses have clearly hurt the party's positioning compared with what it was as President Barack Obama was taking office, its strength is generally back to where it was in the mid-2000s, before a series of events including the Iraq war, high gas prices, and the recession eroded public confidence in George W. Bush and the Republican Party.
At the same time, the Democratic losses have not led to major gains in Republican affiliation. Rather, Gallup finds greater increases in the number of competitive states than in solid or leaning Republican states.
Survey Methods
Results are based on telephone interviews conducted as part of Gallup Daily tracking Jan. 1-Dec. 31, 2010, 2011, with a random sample of 352,840 adults, aged 18 and older, living in all 50 U.S. states and the District of Columbia, selected using random-digit-dial sampling.
For results based on the total sample of national adults, one can say with 95% confidence that the maximum margin of sampling error is ±1 percentage point.
Margins of error for individual states are no greater than ±4 percentage points, and are ±3 percentage points for most states.
Interviews are conducted with respondents on landline telephones and cellular phones, with interviews conducted in Spanish for respondents who are primarily Spanish-speaking. Each daily sample includes a minimum quota of 200 cell phone respondents and 800 landline respondents, with additional minimum quotas among landline respondents for gender within region. Landline respondents are chosen at random within each household on the basis of which member had the most recent birthday.
Samples are weighted to be representative of each state's adult population by gender, age, race, Hispanic ethnicity, education, region, adults in the household, cell phone-only status, cell phone-mostly status, and phone lines. Demographic weighting targets are based on the March 2010 Current Population Survey figures for the aged 18 and older non-institutionalized population living in U.S. telephone households. All reported margins of sampling error include the computed design effects for weighting and sample design.
In addition to sampling error, question wording and practical difficulties in conducting surveys can introduce error or bias into the findings of public opinion polls.
For more details on Gallup's polling methodology, visit www.gallup.com.