PRINCETON, NJ -- Mississippi is home to the largest percentage of conservatives among U.S. states, with a slim majority identifying their political views as conservative. Several other states, including Idaho, Alabama, Wyoming, and Utah approach 50% conservative identification. Vermont, Rhode Island, and the District of Columbia have the greatest percentages of self-identified liberals.
Mississippi is the first state to exceed 50% conservative identifiers in the three years Gallup has compiled ideological identification at the state level.
 |
| Explore complete state data > |
The top 10 rankings make clear that conservative identification is much more common than liberal identification, with each of the top 10 conservative states at or above 45% identification and only the District of Columbia exceeding 31% liberal identification. In the nation as a whole, Americans are about twice as likely to identify as conservative as they are to identify as liberal, a pattern that has persisted for many years. Americans are also more likely to say they are conservative than moderate.
Not surprisingly, then, conservatives outnumber liberals in every U.S. state. Only in the District of Columbia do liberal identifiers exceed conservative identifiers (41% to 18%). Vermont (30.7% conservative to 30.5% liberal), Rhode Island (29.9% to 29.3%), and Massachusetts (29.9% to 28.0%) have the closest state-level division between conservatives and liberals. (The full data on ideology by state can be found on page 2 of this report.)
The most conservative states are typically in the South and West. The least conservative states are in the Eastern part of the country and on the West Coast.
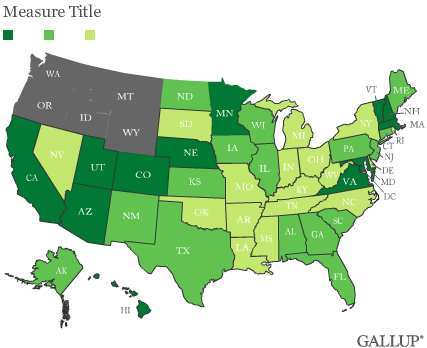
Generally speaking, ideological self-identification tends to be stable over time. As a result, the most and least conservative states have not changed much in recent years. Of the top 10 conservative states in 2010, 8 have been in the top 10 in all three years Gallup has compiled these data at the state level. Of the top 10 liberal states in 2010, 7 have been in the top 10 in all three years.
On average, states saw a one-percentage-point change in their conservative or liberal identification between 2008 and 2010. In contrast, over the same period, party affiliation (as measured by the percentage identifying or leaning Republican) shifted by an average of three points per state, resulting in significant shifts in the competitive positioning of the parties in many states.
Implications
The conservative political label continues to prevail by a significant margin in most of the U.S. states. Additionally, ideological identification has been largely stable in recent years even though there has been greater change in party affiliation at the state level. The 2010 elections brought more politicians who are conservative into office at the state level, and some of the results are evident in the approaches state governments are taking to deal with their biggest challenges, such as attempts to cut pay or benefits of unionized state workers to address revenue shortfalls and budget deficits.
Survey Methods
Results are based on telephone interviews conducted as part of Gallup Daily tracking Jan. 1-Dec. 31, 2010, with a random sample of 182,538 adults, aged 18 and older, living in all 50 U.S. states and the District of Columbia, selected using random-digit-dial sampling.
For results based on the total sample of national adults, one can say with 95% confidence that the maximum margin of sampling error is ±1 percentage point.
The margins of error are no greater than ±6 percentage points for any state, and are ±3 points or less for most states. The margin of error for the District of Columbia is ±7 percentage points.
The questions reported here were asked of a random half-sample of respondents on the Gallup Daily tracking survey.
Interviews are conducted with respondents on landline telephones and cellular phones, with interviews conducted in Spanish for respondents who are primarily Spanish-speaking. Each daily sample includes a minimum quota of 200 cell phone respondents and 800 landline respondents, with additional minimum quotas among landline respondents for gender within region. Landline respondents are chosen at random within each household on the basis of which member had the most recent birthday.
Samples are weighted by gender, age, race, Hispanic ethnicity, education, region, adults in the household, cell phone-only status, cell phone-mostly status, and phone lines. Demographic weighting targets are based on the March 2010 Current Population Survey figures for the aged 18 and older non-institutionalized population living in U.S. telephone households. All reported margins of sampling error include the computed design effects for weighting and sample design.
In addition to sampling error, question wording and practical difficulties in conducting surveys can introduce error or bias into the findings of public opinion polls.
For more details on Gallup's polling methodology, visit www.gallup.com.