PRINCETON, NJ -- More than half of the 10 best job markets in 2010 were in energy- and commodity-producing states. Most of the 10 states with the worst job markets consisted of finance states of the Northeast and the housing-depressed states of the West.
Having a significant presence of natural resource-based industries was a distinct job-creation advantage for states such as North Dakota, West Virginia, Oklahoma, and Texas. These were among the top 10 job markets in 2010, as they were in 2008 and 2009. Also among the top 10 in 2010 were Alaska -- another energy state -- and Washington, D.C., and Maryland, both of which benefit from having a large percentage of federal government workers. Mostly farm commodity states -- including Arkansas, South Dakota, Iowa, and Pennsylvania -- fill out the top 10.
 |
| Explore complete state data > |
Despite an overall improvement in job market conditions, 5 states in the bottom 10 during 2008 and 2009 were also on the list in 2010: Nevada, Connecticut, Rhode Island, New Jersey, and California. These states continue to suffer from the housing crash and financial debacle that was part of the recession. The remainder of the worst 10 markets are also in the Northeast and West: New York, New Hampshire, Vermont, Maine, Idaho, and Oregon. (The full Job Creation Index data by state can be found on page 2 of this report.)
Most and Least Job Market Improvement
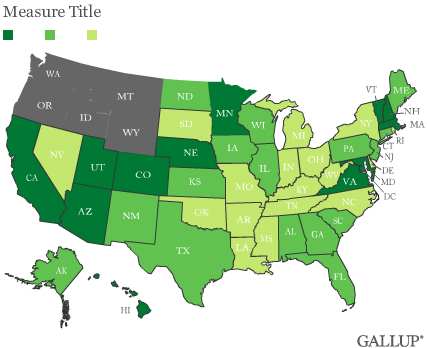
States showing the most improvement in job market conditions between 2009 and 2010 included the long-depressed manufacturing states of Michigan, Ohio, and Pennsylvania -- likely reflecting the significant improvement in U.S. manufacturing last year. Also among the most improved were 5 of the 10 states with the worst job markets in 2009, giving them the most room to improve: Oregon, Delaware, Arizona, Minnesota, along with Michigan. Reflecting the growth of the federal government, the District of Columbia was not only the second-best job market but also the second-most improved job market in 2010.
Eight of the states showing the least improvement last year were in the 10 best job markets in 2009, including New Mexico, Nebraska, West Virginia, Louisiana, Maryland, Oklahoma, Texas, and Virginia. Also among those showing the least improvement are several states in the Northeast -- New Jersey, Vermont, and New York -- and two smaller states in the West, Montana and Wyoming.
These results are based on aggregated data from nearly 200,000 interviews with employed adults during 2010, conducted as part of Gallup Daily tracking. Gallup asks those who are employed whether their companies are hiring workers and expanding the size of their labor forces, not changing the size of their workforces, or laying off workers and reducing their workforces. The figures reported here represent the net difference between the percentage reporting an expansion and the percentage reporting a reduction in their workforces.
Gallup's Job Creation Index averaged +7 nationwide during 2010, with 28% of employees reporting their companies were hiring and 21% saying their companies were letting people go. Regionally, job market creation was best in the Midwest and South but lagged behind in the East and West.
State Job Market Conditions May Bring More of the Same in 2011
U.S. job market conditions improved in early 2010 relative to 2009, but have flattened out during recent months. Today's job market conditions, like those of late 2010, are still a long way from those of 2008 -- the first year of the Great Recession.
Generally speaking, relative state job market conditions in 2010 were similar to those of the recession years of 2008 and 2009: energy and commodity states continued to see their job markets do comparatively well throughout. Areas dominated by federal government employment continued to do well as federal spending surged.
On the other hand, job market conditions in housing-crash and financial industry states continued to fare comparatively poorly. Still, the pickup in manufacturing activity and U.S. exports over the past year has helped improve job market conditions in the Midwest, allowing several industrial states to be in the most improved category, including Michigan, Ohio, and Pennsylvania, and allowing Michigan to move out of the worst 10 job markets.
Looking ahead, it seems likely that the overall pattern of state job market conditions across the nation in 2011 will remain similar to those of the past three years. Energy prices are surging and gas is now $3.29 a gallon nationwide, compared with $2.69 a year ago. High oil prices tend to improve hiring activity in energy-producing states. Similarly, high commodity prices should help job conditions in the farm and mining states.
On the other hand, the housing market continues to suffer. This suggests that states with the worst housing conditions will continue to see relatively difficult job market conditions for some time.
Of course, it is possible that state and federal budget cutbacks could hurt job market conditions in some states more than others, particularly those having the worst budget problems, such as California, New York, and Illinois. Or, federal budget cuts could hurt states with a large number of federal government employees. Alternatively, U.S. manufacturing and exports could continue to increase, providing more jobs in industrial states.
Whatever happens, what the state job markets need most right now is economic growth that creates new jobs and improves job market conditions in every state, something sorely lacking over the past three years.
Survey Methods
Results are based on telephone interviews conducted as part of Gallup Daily tracking Jan. 1-Dec. 31, 2010, with a random sample of 195,963 adults, aged 18 and older, living in all 50 U.S. states and the District of Columbia, selected using random-digit-dial sampling.
For results based on the total sample of national adults, one can say with 95% confidence that the maximum margin of sampling error is ±1 percentage point.
The margins of error are ±4 percentage points or less for most states. The margin of error for the District of Columbia is ±6 percentage points.
Interviews are conducted with respondents on landline telephones and cellular phones, with interviews conducted in Spanish for respondents who are primarily Spanish-speaking. Each daily sample includes a minimum quota of 200 cell phone respondents and 800 landline respondents, with additional minimum quotas among landline respondents for gender within region. Landline respondents are chosen at random within each household on the basis of which member had the most recent birthday.
Samples are weighted to be representative of each state's adult population by gender, age, race, Hispanic ethnicity, education, region, adults in the household, cell phone-only status, cell phone-mostly status, and phone lines. Demographic weighting targets are based on the March 2009 Current Population Survey figures for the aged 18 and older non-institutionalized population living in U.S. telephone households. All reported margins of sampling error include the computed design effects for weighting and sample design.
Interviews are conducted with respondents on landline telephones and cellular phones, with interviews conducted in Spanish for respondents who are primarily Spanish-speaking. Each daily sample includes a minimum quota of 200 cell phone respondents and 800 landline respondents, with additional minimum quotas among landline respondents for gender within region. Landline respondents are chosen at random within each household on the basis of which member had the most recent birthday.
Samples are weighted by gender, age, race, Hispanic ethnicity, education, region, adults in the household, cell phone-only status, cell phone-mostly status, and phone lines. Demographic weighting targets are based on the March 2010 Current Population Survey figures for the aged 18 and older non-institutionalized population living in U.S. telephone households. All reported margins of sampling error include the computed design effects for weighting and sample design.
In addition to sampling error, question wording and practical difficulties in conducting surveys can introduce error or bias into the findings of public opinion polls.
For more details on Gallup's polling methodology, visit www.gallup.com.