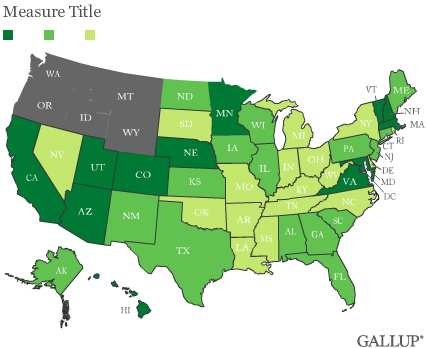
PRINCETON, NJ -- Residents of 16 states and the District of Columbia gave President Obama approval ratings of 50% or higher during the first half of 2011, led by the District of Columbia, Connecticut, Maryland, and Delaware. Idaho residents had the least positive appraisal of his performance, with 27% approving.
These results are based on aggregated Gallup Daily tracking data from January through June, consisting of nearly 90,000 interviews nationally. Obama averaged 47% approval on a nationwide basis during this time. Each state's data is weighted so it is demographically representative of the state's population. The full data for each state can be found on page 2 of this report.
Obama's support is greatest in the East, with 8 of his 10 highest approval ratings occurring in states located in the Northeast or Mid-Atlantic region of the country. The 2 non-Eastern states ranking among the 10 highest are Obama's home states of Hawaii and Illinois.
States giving Obama his lowest approval ratings are more varied regionally, with several in the West but also including Southern and Midwestern states.
Steady State Approval Ratings
Obama's national half-year average approval rating of 47% matches his average nationwide approval rating for all of 2010. As such, there has been little meaningful change since 2010 in his ratings at the state level as well.
The president did receive a 50% or higher approval rating in a few more states during the first half of 2011 than he did in 2010 -- 16 compared with 12, along with the District of Columbia in both time periods. His approval rating crept back to the 50% level in Maine, Michigan, Wisconsin, and Minnesota in the first part of 2011 after being below that level in those states in 2010.
Implications
As President Obama prepares for his re-election bid next year, his approval ratings nationally and at the state level bear watching. Typically, presidents with approval ratings above 50% get re-elected, though George W. Bush won re-election in 2004 with a 48% approval rating at the time of the election.
Thus, a key for Obama is to try to push his national approval rating back above the 50% mark before November 2012, and to have it at or above that level in as many states as possible, given that the presidential election will be determined by the winner of the greater number of state electoral votes. Currently, a majority of states show approval ratings below 50%, though whether Obama is victorious will also depend in part on who his GOP challenger is, whether a significant third-party candidate runs, and the degree to which the president's supporters turn out to vote.
This story is part of a series of midyear updates on Gallup's State of the States data, to be released in August on Gallup.com. Gallup.com will report new full-year totals in early 2012 based on all 2011 surveys.
Explore President Obama's approval ratings in depth and compare them with those of past presidents in the Gallup Presidential Job Approval Center.
Survey Methods
Results are based on telephone interviews conducted as part of Gallup Daily tracking Jan. 2-June 30, 2011, with a random sample of 89,965 adults, aged 18 and older, living in all 50 U.S. states and the District of Columbia.
For results based on the total sample of national adults, one can say with 95% confidence that the maximum margin of sampling error is ±1 percentage points.
Sample sizes for individual states range from lows of 180 for the District of Columbia and 242 for Hawaii to a high of 8,549 for California. Margins of error for most states are ±4 percentage points or less.
Interviews are conducted with respondents on landline telephones and cellular phones, with interviews conducted in Spanish for respondents who are primarily Spanish-speaking. Each sample includes a minimum quota of 400 cell phone respondents and 600 landline respondents per 1,000 national adults, with additional minimum quotas among landline respondents for gender within region. Landline telephone numbers are chosen at random among listed telephone numbers. Cell phone numbers are selected using random-digit-dial methods. Landline respondents are chosen at random within each household on the basis of which member had the most recent birthday.
Samples are weighted by gender, age, race, Hispanic ethnicity, education, region, adults in the household, and phone status (cell phone only/landline only/both, cell phone mostly, and having an unlisted landline number). Demographic weighting targets are based on the March 2010 Current Population Survey figures for the aged 18 and older non-institutionalized population living in U.S. telephone households. All reported margins of sampling error include the computed design effects for weighting and sample design.
In addition to sampling error, question wording and practical difficulties in conducting surveys can introduce error or bias into the findings of public opinion polls.
For more details on Gallup's polling methodology, visit www.gallup.com.