PRINCETON, NJ -- Americans' economic confidence plunged to -53 in the week ending Aug. 7, a level not seen since the recession days of March 2009. This deterioration coincided with the final wrangling over the U.S. debt ceiling and Standard and Poor's downgrade of the United States' debt rating. Economic confidence is now far worse than the -43 of two weeks ago and the -34 of a month ago.
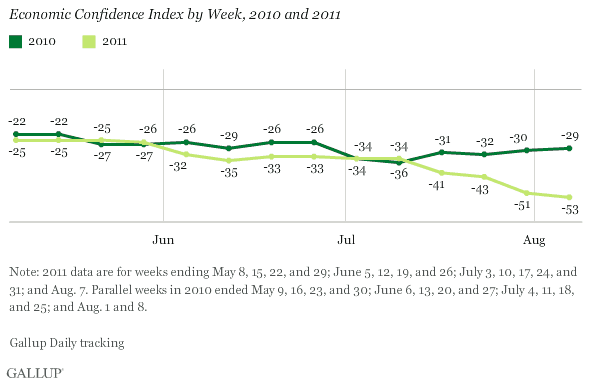
U.S. economic confidence deteriorated even faster in July and the first week of August than it did in June compared with May. This plunge in confidence contrasts with the relatively flat trend in 2010. It also places consumer perceptions of the economy in the range of March 2009 during the recession. Gallup's Economic Confidence Index hit its recession/financial crisis weekly low of -65 -- just 12 points worse than now -- during the week of Oct. 6-12, 2008.
Gallup's Economic Confidence Index combines two measures: one assessing Americans' views about whether the U.S. economy is "getting better" or "getting worse," and the second involving Americans' ratings of current economic conditions as "excellent," "good," "only fair," or "poor." The Index's inception was in January 2008. Both weekly ratings are at their lows since early 2009.
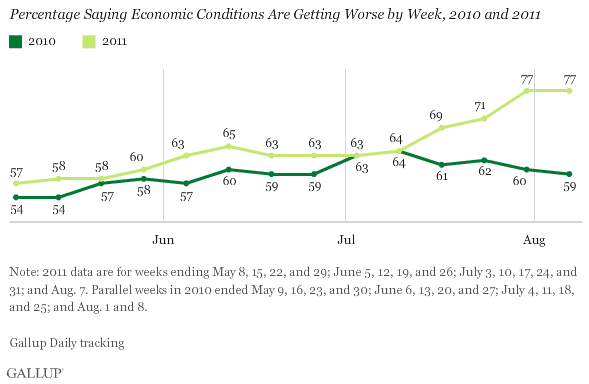
Percentage "Getting Worse" Up Substantially vs. 2010
Seventy-seven percent of Americans said the U.S. economy is getting worse in the week ending Aug. 7. This is up from 71% two weeks prior and 64% a month ago. Substantially more Americans say the U.S. economy is getting worse right now than said so at this time a year ago.
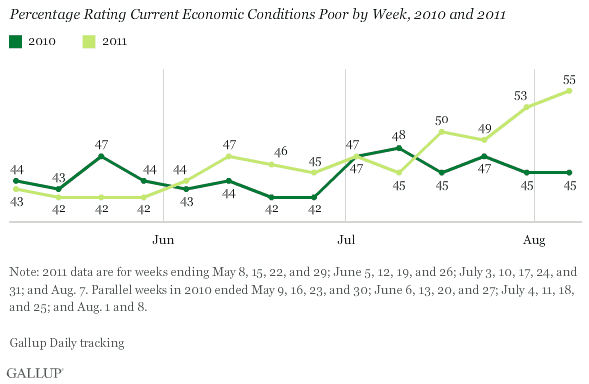
Percentage Rating the Economy "Poor" Going Higher
Fifty-five percent of Americans rated current economic conditions "poor" in the week ending Aug. 7 -- up from 49% two weeks ago. This is 10 percentage points worse than the 45% of a month ago and a year ago.
Monthly Economic Confidence Shows July Decline
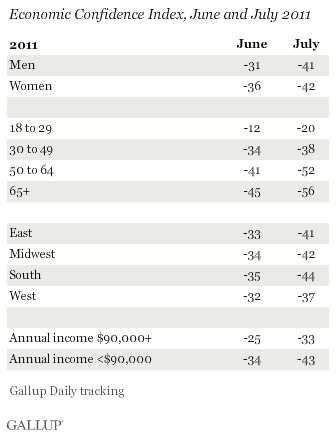
During July overall, Americans' confidence in the U.S. economy plunged to -42 -- its lowest level since March 2009. This was fairly consistent across various demographic groups. For example, confidence among those making less than $90,000 a year worsened by nine points to -43 while that among those making $90,000 or more worsened by eight points to -33.
See complete demographic data on page 2.
Implications
There has been a lot of concern over the past several weeks about the federal debt ceiling debate and the potential impact "default" might have on Wall Street and the U.S. economy overall. During recent days, the same has been true regarding Friday's downgrade of U.S. debt.
The reality is that there should be more concern about the impact of these events on Americans' confidence in the economy than about their impact on Wall Street investors' confidence. The first-half GDP numbers show the U.S. economy has been growing a lot more slowly than many economists thought. Gallup Daily tracking of economic confidence during July and the first week of August suggests that this economic deterioration combined with the battle over the debt ceiling in Washington has sent consumer economic expectations plunging.
On Monday, the downgrading of U.S. government debt and fears that the economy will continue to weaken led to another plunge on Wall Street. A similar impact on economic confidence might well be expected in the days ahead. This could send Gallup's measures of consumer perceptions of the economy even closer to where they were during the depths of the recession and financial crisis.
Gallup.com reports results from these indexes in daily, weekly, and monthly averages and in Gallup.com stories. Complete trend data are always available to view and export in the following charts:
Daily: Employment, Economic Confidence and Job Creation, Consumer Spending
Weekly: Employment, Economic Confidence, Job Creation, Consumer Spending
Read more about Gallup's economic measures.
View our economic release schedule.
Survey Methods
Results are based on telephone interviews conducted on a weekly basis in 2011 to the week ending Aug. 7 and in 2010 to the week ending Aug. 8. For the week ending Aug. 7, 2011, on the Gallup Daily tracking survey, interviews were conducted with a random sample of 3,492 adults, aged 18 and older, living in all 50 U.S. states and the District of Columbia.
For results based on the total sample of national adults, one can say with 95% confidence that the maximum margin of sampling error is ±3 percentage points.
Interviews are conducted with respondents on landline telephones and cellular phones, with interviews conducted in Spanish for respondents who are primarily Spanish-speaking. Each sample includes a minimum quota of 400 cell phone respondents and 600 landline respondents per 1,000 national adults, with additional minimum quotas among landline respondents by region. Landline telephone numbers are chosen at random among listed telephone numbers. Cell phone numbers are selected using random-digit-dial methods. Landline respondents are chosen at random within each household on the basis of which member had the most recent birthday.
Samples are weighted by gender, age, race, Hispanic ethnicity, education, region, adults in the household, and phone status (cell phone only/landline only/both, cell phone mostly, and having an unlisted landline number). Demographic weighting targets are based on the March 2010 Current Population Survey figures for the aged 18 and older non-institutionalized population living in U.S. telephone households. All reported margins of sampling error include the computed design effects for weighting and sample design.
In addition to sampling error, question wording and practical difficulties in conducting surveys can introduce error or bias into the findings of public opinion polls.
For more details on Gallup's polling methodology, visit www.gallup.com.