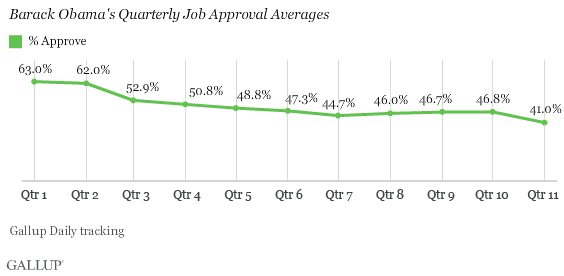
PRINCETON, NJ -- President Barack Obama's 11th quarter in office was the worst of his administration, based on his quarterly average job approval ratings. His 41% approval average is down six percentage points from his 10th quarter in office, and is nearly four points below his previous low of 45% during his seventh quarter.

These results are based on Gallup Daily tracking from July 20-Oct. 19, 2011. During this time, Obama's approval rating ranged narrowly between 38% and 43% for all but a few days of the quarter. The 38% approval ratings, registered on several occasions, are the lowest of his presidency to date.
The most notable event in Obama's 11th quarter was probably the negotiations to raise the federal debt ceiling in late July and early August. Shortly after the agreement was reached, the stock market plummeted after Standard and Poor's downgraded the U.S. credit rating. Later, the government's jobs report showed no new net jobs were created in August, a sign the economy was still a long way from recovery. The president has been unsuccessful so far in getting Congress to pass the jobs bill he proposed in early September.
Obama's 11th Quarter Weak From Historical Perspective
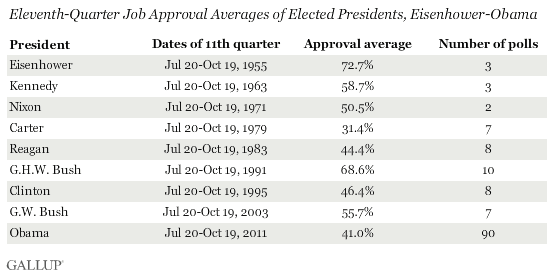
Only one elected president since Dwight D. Eisenhower, Jimmy Carter, had a lower 11th quarter average than Obama. Carter averaged 31% during his 11th quarter, which was marked by a poor economy and high energy prices. Ronald Reagan and Bill Clinton were the only other post-World War II presidents whose job approval averages were below 50% in their 11th quarter in office.

Notably, Reagan's and Clinton's popular support recovered and both were elected to a second term. Carter's support also improved in the short term, thanks to a rally in approval after the Iranian hostage crisis began, but as that crisis dragged on and the economy remained weak, his approval rating eventually declined before he was defeated in the 1980 election.
Obama's re-election prospects should become clearer in the coming months, because Gallup analysis shows that an incumbent president's 12th- and 13th-quarter averages give a strong indication of whether he will win a second term.
From a broader historical perspective, Obama's 11th-quarter approval average of 41% ranks 220th out of the 262 presidential quarters for which Gallup has data since the Truman administration. That translates to the 16th percentile, placing it in the bottom fifth of presidential quarters. Thus, Obama's recent approval ratings are well below average.
Obama's approval rating for his entire term to date now averages 50%.
Implications
President Obama's most recent quarter in office was his worst to date, and these lower levels of public support could put his re-election chances in peril unless things start to improve in the next few months. Currently, voters say they are more likely to vote for "the Republican candidate" than for Obama for president in 2012, though Obama has generally looked stronger when matched against actual Republican candidates like Mitt Romney or Rick Perry.
Americans' satisfaction with the direction of the country remains at historically low levels, and Americans clearly identify the economy and unemployment as the most important problems facing the United States. Thus, a second Obama term likely hinges on whether there are signs of economic progress in the coming months.
Survey Methods
Results are based on telephone interviews conducted as part of Gallup Daily tracking July 20-Oct. 19, 2011, with a random sample of 45,989 adults, aged 18 and older, living in all 50 U.S. states and the District of Columbia.
For results based on the total sample of national adults, one can say with 95% confidence that the maximum margin of sampling error is ±1 percentage point.
Interviews are conducted with respondents on landline telephones and cellular phones, with interviews conducted in Spanish for respondents who are primarily Spanish-speaking. Each sample includes a minimum quota of 400 cell phone respondents and 600 landline respondents per 1,000 national adults, with additional minimum quotas among landline respondents by region. Landline telephone numbers are chosen at random among listed telephone numbers. Cell phone numbers are selected using random-digit-dial methods. Landline respondents are chosen at random within each household on the basis of which member had the most recent birthday.
Samples are weighted by gender, age, race, Hispanic ethnicity, education, region, adults in the household, and phone status (cell phone only/landline only/both, cell phone mostly, and having an unlisted landline number). Demographic weighting targets are based on the March 2010 Current Population Survey figures for the aged 18 and older non-institutionalized population living in U.S. telephone households. All reported margins of sampling error include the computed design effects for weighting and sample design.
The questions reported here were asked of a random half-sample of respondents each night on the Gallup Daily tracking survey.
In addition to sampling error, question wording and practical difficulties in conducting surveys can introduce error or bias into the findings of public opinion polls.
For more details on Gallup's polling methodology, visit www.gallup.com.
