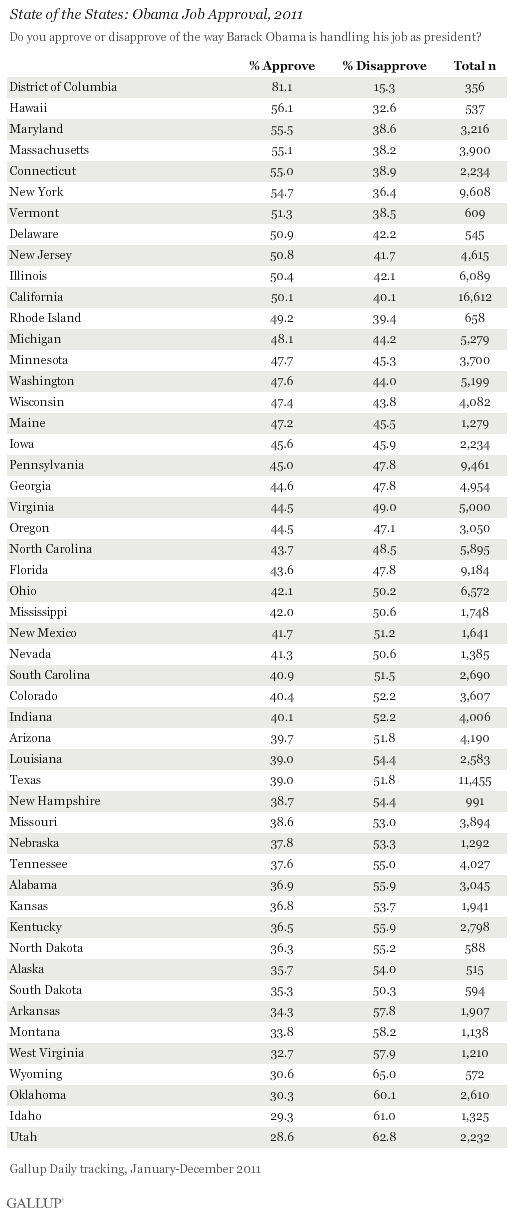
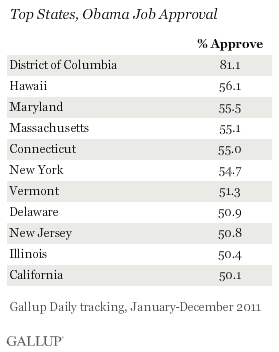
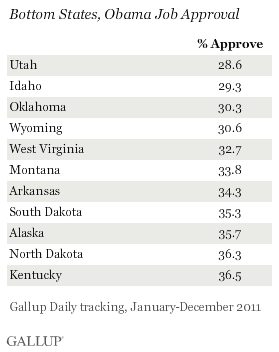
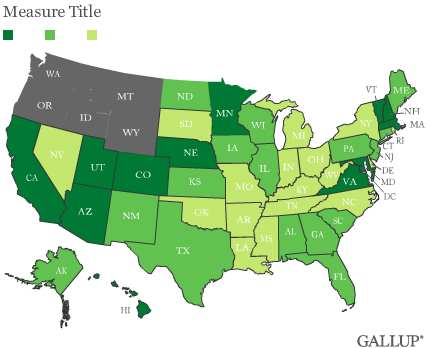
PRINCETON, NJ -- In 10 states plus the District of Columbia, a majority of residents approved of the job Barack Obama was doing as president last year, according to aggregated data from 2011. His greatest support came from District of Columbia, Maryland, and Hawaii residents, while Utah and Idaho residents gave him his lowest levels of support -- below 30%.
 |
| Explore complete state data > |
Eastern states largely make up the list of those with the highest approval ratings of Obama -- those above majority approval. Eight of the top 11 are from the Northeast or Mid-Atlantic areas of the country. The exceptions are Obama's birth state of Hawaii, his home state of Illinois, and California.
The states with the lowest approval ratings are more regionally diverse, with the greatest number -- five, including Alaska -- in the Western part of the United States.
Obama Approval Ratings Down in Most States
Overall, Obama averaged 44% job approval in his third year in office, down from 47% in his second year. His approval rating declined from 2010 to 2011 in most states, with Wyoming, Connecticut, and Maine showing a marginal increase, and Massachusetts, Wisconsin, Minnesota, New Jersey, Arizona, West Virginia, Michigan, and Georgia showing declines of less than a full percentage point. The greatest declines were in Hawaii, South Dakota, Nebraska, and New Mexico.
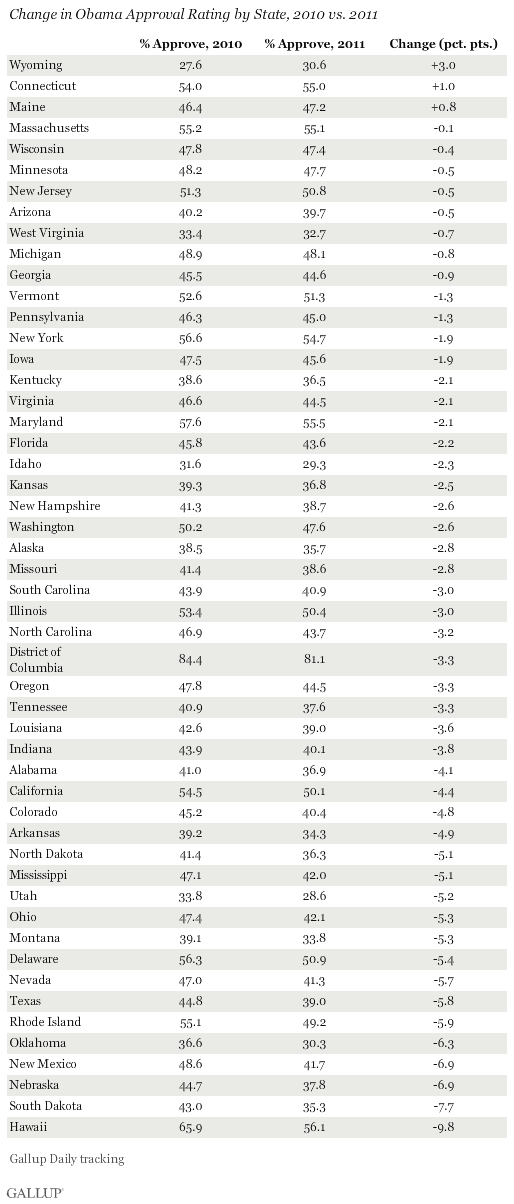
With the average state showing a 3.2-point drop in approval between 2010 and 2011, the number of states showing majority approval of Obama did not change much between the two years, moving from 12 states and the District of Columbia in 2010 to 10 states plus D.C. in 2011. Washington state and Rhode Island were the two states that dropped below 50% approval last year.
However, Obama was on pace to show an increase in majority approval states -- to 16 plus the District of Columbia -- midway through 2011. But his lower approval ratings in the third and fourth quarters of the year resulted in a net decline in the number of states above 50% approval by the time the year was complete.
Implications
Obama's approval rating at the state level provides some insight into his chances to win an Electoral College majority. He would seem to be well-positioned in the states in which his approval rating was above 50% last year, including three of the larger states in California, New York, and Illinois. The states with majority approval of Obama in 2011 account for 159 electoral votes. Obama won all of those states' electoral votes in the 2008 election.
On the other hand, states in which his approval rating was below 40% seem less likely to recover enough to allow Obama to claim their electoral votes this fall. Those states account for 153 electoral votes. All except New Hampshire voted for John McCain in 2008.
Thus, the key to Obama's winning a second term lies in the states whose approval rating is in the 40% range, which account for the remaining 226 electoral votes and include traditional "swing states" such as Ohio, Pennsylvania, and Florida. Obama won the vast majority of these states in 2008.
Gallup and USA Today have identified 12 swing states that will be vitally important in this year's election, and Obama's job approval rating within those states ranges from 39% in New Hampshire to 48% in Michigan.
His approval rating is a key indicator of his electoral vote chances, but it alone will not dictate his success in a given state's vote. The electorate in each state represents a smaller share of the population than the larger pool of all state residents on which his approval rating is based, so turnout among his supporters and opponents will be important. Also, state residents' electoral choice will be shaped in part by the choice voters have between Obama and his Republican opponent, and potential third-party candidates.
Gallup will update Obama's state-by-state approval ratings in July. To date in 2012, his job approval rating remains just about where it was in 2011, with an average 45% approval rating for the week of Jan. 23-29. That makes his re-election prospects uncertain, but within striking distance of the historical minimum approval (48% by George W. Bush in 2004) a winning president has had at the time of his re-election vote.
Gallup's "State of the States" series reveals state-by-state differences on political, economic, and well-being measures Gallup tracks each day. New stories based on full-year 2011 data will be released throughout the month of February.
Survey Methods
Results are based on telephone interviews conducted as part of Gallup Daily tracking Jan. 1-Dec. 31, 2011, with a random sample of 179,170 adults, aged 18 and older, living in all 50 U.S. states and the District of Columbia.
For results based on the total sample of national adults, one can say with 95% confidence that the maximum margin of sampling error is ±1 percentage point.
Margins of error for individual states are no greater than ±5 percentage points, and are ±3 percentage points in most states. The margin of error for the District of Columbia is ±7 percentage points.
Interviews are conducted with respondents on landline telephones and cellular phones, with interviews conducted in Spanish for respondents who are primarily Spanish-speaking. Each sample includes a minimum quota of 400 cell phone respondents and 600 landline respondents per 1,000 national adults, with additional minimum quotas among landline respondents by region. Landline telephone numbers are chosen at random among listed telephone numbers. Cell phone numbers are selected using random-digit-dial methods. Landline respondents are chosen at random within each household on the basis of which member had the most recent birthday.
Samples are weighted by gender, age, race, Hispanic ethnicity, education, region, adults in the household, and phone status (cell phone only/landline only/both, cell phone mostly, and having an unlisted landline number). Demographic weighting targets are based on the March 2011 Current Population Survey figures for the aged 18 and older non-institutionalized population living in U.S. telephone households. All reported margins of sampling error include the computed design effects for weighting and sample design.
In addition to sampling error, question wording and practical difficulties in conducting surveys can introduce error or bias into the findings of public opinion polls.
For more details on Gallup's polling methodology, visit www.gallup.com.