PRINCETON, NJ -- Job market conditions improved in the United States in January as Gallup's U.S. Job Creation Index reached +16, its highest point since September 2008.
Hiring and Firing Improve, Are at Best Levels Since 2008
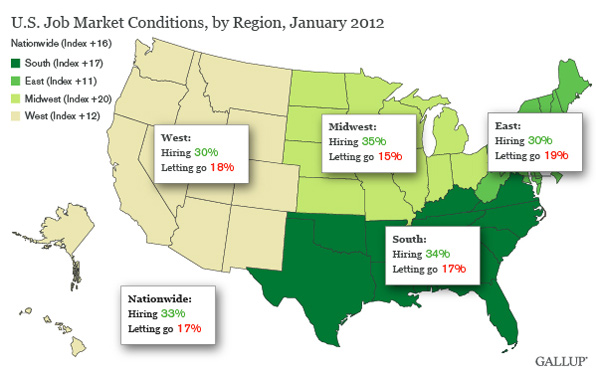
The Job Creation Index of +16 is based on 33% of workers nationwide saying their employers are hiring workers and expanding the size of their workforce, and 17% saying their employers are letting workers go and reducing the size of their workforce. Hiring and firing have each improved by one percentage point since December. The percentage hiring matches the 33% of June 2011, and the two reflect the highest hiring levels since September 2008. The percentage letting go is the lowest since June 2008.
Job Market Conditions Show Improvement vs. a Year Ago in All Regions
Job market conditions remain best in the Midwest, with a Job Creation Index of +20; the South is second, at +17. The Index is +11 in the East and +12 in the West. The largest year-over-year improvement has been in the Midwest and the West, both of which are up by seven points. The index has increased by four points in the South and three points in the East compared with the same month a year ago.
Implications
January's increase in Gallup's Job Creation Index is good news about job market conditions. The index is not seasonally adjusted and the job situation usually deteriorates at this time of year, making the improvement last month even more impressive.
The index also seems consistent with the government's weekly report on jobless claims, which are running under 400,000. Over time, the Job Creation Index has tended to correlate with this government report.
Job market conditions are uneven across the nation. In the Midwest, they are at their best since April 2008. Similarly, in the South, conditions are at their best since September 2008. This may suggest that manufacturing continues to improve in the middle of the country, helping those regions' job conditions to outpace conditions on both coasts.
Overall, Gallup's Job Creation Index suggests an improving job environment in January. This is probably not yet enough to stimulate significant job growth, but is enough to keep job conditions from deteriorating and is sufficient to provide some added optimism about the job situation going forward.
Gallup.com reports results from these indexes in daily, weekly, and monthly averages and in Gallup.com stories. Complete trend data are always available to view and export in the following charts:
Daily: Employment, Economic Confidence and Job Creation, Consumer Spending
Weekly: Employment, Economic Confidence, Job Creation, Consumer Spending
Read more about Gallup's economic measures.
View our economic release schedule.
Survey Methods
For Gallup Daily tracking, Gallup interviews approximately 1,000 national adults, aged 18 and older, each day. The Gallup Job Creation Index results are based on a random sample of approximately 500 current full- and part-time employees each day.
National results for January are based on Gallup Daily tracking interviews with 17,290 employees conducted Jan. 1-31, 2012. For this sample, one can say with 95% confidence that the maximum margin of sampling error is ±1 percentage point. Regional results for January are based on interviews totaling more than 3,000 in each region. For each total regional sample, the maximum margin of sampling error is ±3 percentage points.
Interviews are conducted with respondents on landline telephones and cellular phones, with interviews conducted in Spanish for respondents who are primarily Spanish-speaking. Each sample includes a minimum quota of 400 cell phone respondents and 600 landline respondents per 1,000 national adults, with additional minimum quotas among landline respondents by region. Landline telephone numbers are chosen at random among listed telephone numbers. Cell phone numbers are selected using random-digit-dial methods. Landline respondents are chosen at random within each household on the basis of which member had the most recent birthday.
Samples are weighted by gender, age, race, Hispanic ethnicity, education, region, adults in the household, and phone status (cell phone only/landline only/both, cell phone mostly, and having an unlisted landline number). Demographic weighting targets are based on the March 2011 Current Population Survey figures for the aged 18 and older non-institutionalized population living in U.S. telephone households. All reported margins of sampling error include the computed design effects for weighting and sample design.
In addition to sampling error, question wording and practical difficulties in conducting surveys can introduce error or bias into the findings of public opinion polls.
For more details on Gallup's polling methodology, visit www.gallup.com.