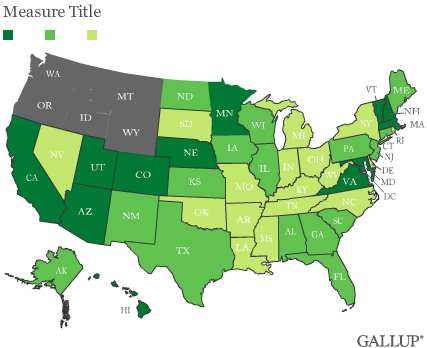
PRINCETON, NJ -- Mississippi remains the most conservative state in the union, and, along with Utah, Wyoming, and Alabama, is one of four states with 50% or more of its population identifying as conservative. At the other end of the ideological spectrum, 40% District of Columbia residents and 30% of Massachusetts residents identify as liberal; all other states have a liberal population of 26% or less.
 |
| Explore complete state data > |
As has been the case in recent years, Americans overall are significantly more likely to identify as conservative than as liberal. Forty percent of more than 218,000 adults 18 and older interviewed in Gallup tracking in 2011 said they were conservative, 36% were moderate, and 21% liberal. Only in the District of Columbia and Massachusetts did liberals outnumber conservatives.
Politics in America today varies widely across the states and regions of the country, and ideology is no exception. Mississippi and Massachusetts are the two states that provide the most extreme contrast, with 53% of Mississippians identifying as conservative and 11% identifying as liberal, while 29% of Massachusetts residents are conservative and 30% are liberal.
More generally, the 10 most conservative states in 2011 were in the South (Mississippi, Alabama, Louisiana, Arkansas, and Tennessee), the Midwest (Oklahoma and Nebraska), and the West (Utah, Wyoming, and Idaho). None were on the East or West Coast.
By contrast, all of the 11 most liberal states in 2011 were coastal -- the District of Columbia, Massachusetts, New York, New Jersey, Rhode Island, New Hampshire, and Connecticut in the East, and Oregon, Washington, Hawaii, and California in the West.
The full data for each state can be found on page 2 of this article.
Unlike political party identification, which has shifted significantly over the last four years, the state-by-state patterns in ideology have remained remarkably stable this year compared with previous years. The percentage of each state identifying as conservative changed by only a percentage point or two in most states from 2010 to 2011. Mississippi has been the most conservative state in the union in three of the last four years; in 2009, Alabama was the most conservative by a slight margin over Mississippi.
The largest change in conservative percentage from 2010 to 2011 was in Alaska, where the proportion of self-identified conservatives dropped to 33% in 2011 from 41% in 2010. There was little change in the liberal percentage over the last year in most states. The largest changes came in Vermont, with a drop to 24% from 31% liberal, and Rhode Island, with a drop to 25% from 29%.
Bottom Line
America remains a conservative nation, at least as measured by the ideological labels Americans choose to use to identify themselves. Residents of all states of the union except for Massachusetts and the District of Columbia are more likely to identify as conservative than as liberal, and in every state except D.C., residents are also more likely to say they are moderate than liberal. The general distribution of ideology across the states follows traditional red-blue distinctions, with liberals most highly represented on the East and West Coasts, while conservatives dominate in Southern, Midwestern, and Western states.
Gallup's "State of the States" series reveals state-by-state differences on political, economic, and well-being measures Gallup tracks each day. New stories based on full-year 2011 data will be released throughout the month of February.
Survey Methods
Results are based on telephone interviews conducted as part of Gallup Daily tracking Jan. 1-Dec. 31, 2011, with a random sample of 218,537 adults, aged 18 and older, living in all 50 U.S. states and the District of Columbia.
For results based on the total sample of national adults, one can say with 95% confidence that the maximum margin of sampling error is ±1 percentage point.
Margins of error for individual states are no greater than ±4 percentage points, and are ±3 percentage points in most states. The margin of error for the District of Columbia is ±5 percentage points.
Interviews are conducted with respondents on landline telephones and cellular phones, with interviews conducted in Spanish for respondents who are primarily Spanish-speaking. Each sample includes a minimum quota of 400 cell phone respondents and 600 landline respondents per 1,000 national adults, with additional minimum quotas among landline respondents by region. Landline telephone numbers are chosen at random among listed telephone numbers. Cell phone numbers are selected using random-digit-dial methods. Landline respondents are chosen at random within each household on the basis of which member had the most recent birthday.
Samples are weighted by gender, age, race, Hispanic ethnicity, education, region, adults in the household, and phone status (cell phone only/landline only/both, cell phone mostly, and having an unlisted landline number). Demographic weighting targets are based on the March 2011 Current Population Survey figures for the aged 18 and older non-institutionalized population living in U.S. telephone households. All reported margins of sampling error include the computed design effects for weighting and sample design.
In addition to sampling error, question wording and practical difficulties in conducting surveys can introduce error or bias into the findings of public opinion polls.
For more details on Gallup's polling methodology, visit www.gallup.com.