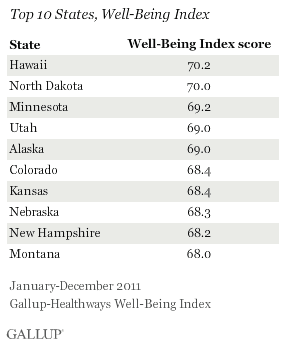
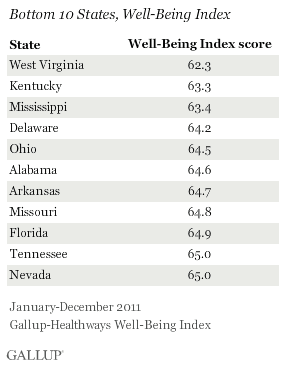
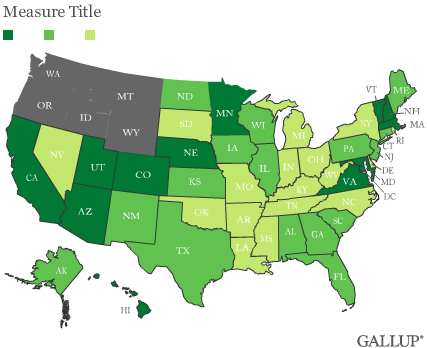
WASHINGTON, D.C. -- Hawaii residents had the highest well-being in the nation in 2011 with a Gallup-Healthways Well-Being Index score of 70.2, maintaining that state's No. 1 status for a third consecutive year. North Dakota, Minnesota, Utah, and Alaska rounded out the top five states. West Virginia residents had the lowest well-being, with a score of 62.3, slightly improved from 61.7 in 2010.
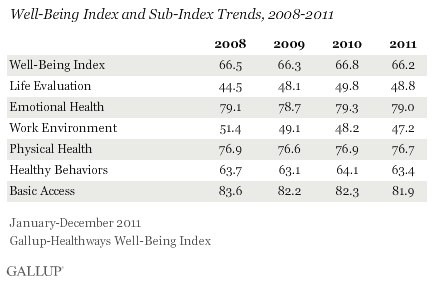
The Well-Being Index score for the nation was 66.2 in 2011, down slightly from 66.8 in 2010 and the lowest score Gallup and Healthways have recorded since tracking began in 2008. The decrease in the overall score in 2011 is because of small declines across all six of the sub-indexes that comprise the Well-Being Index.
Most of the state-level scores, however, were statistically unchanged in 2011 from 2010.
Western States Continue to Have Higher Well-Being, Southern States Lower
Overall, Western and Midwestern states earned 9 of the 10 highest well-being scores, while Southern states accounted for half of the 10 lowest well-being scores.
This overarching geographic pattern in well-being has been consistent over the past four years.
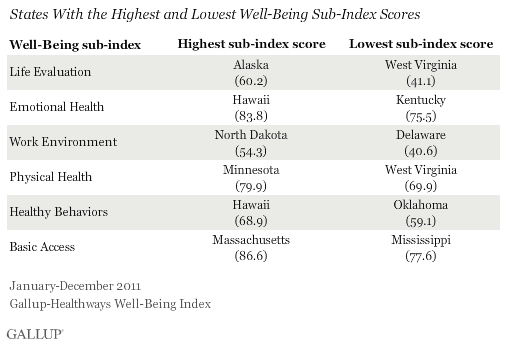
Top and Bottom Performers in the Six Key Areas of Well-Being
Hawaii's high scores on the Emotional Health and Healthy Behaviors Indexes helped the state hold onto its top spot overall. In terms of emotional health specifically, Hawaii residents were the most likely to say they smiled or laughed a lot "yesterday" and the least likely to report daily worry or stress and to have ever been diagnosed with depression. Residents' good eating and exercise habits and lower smoking rates earned them the distinction of having the best healthy behaviors in the nation.
Alaskans were the most likely to rate their lives highly enough to be "thriving," giving them the highest Life Evaluation score in the nation, while West Virginians were the least likely to do so, putting them in last place on this metric. West Virginia also remained the state with the highest percentage of obese residents, contributing to its last-place ranking on the Physical Health Index.
Massachusetts led on access to basic necessities, as it did in 2010, with a Basic Access score of 86.6. This high rating is partly a result of the high percentage of residents who have health insurance in the state. The Basic Access Index also measures residents' access to other items essential to well-being, including enough money for food, shelter, and medicine; a safe place to exercise; and satisfaction with one's community. Mississippi performed the worst in this area, as it did last year.
North Dakota workers reported the best work environments in the country. Delaware workers had the worst workplace perceptions for the third year in a row. The Work Environment Index measures issues that include a trusting and open work environment and whether an employee is able to use his or her strengths to do what he or she does best every day.
Implications
Well-being across states remains essentially static, reflecting the continuing sluggish economy. While some states are standouts year after year, even those places have yet to see significant improvement in residents' overall well-being since the financial crisis of 2008.
Improving well-being poses a challenge for leaders as many states continue to face severe fiscal problems, reductions in public services, public-sector layoffs or salary cuts, and decreases in federal aid. High unemployment, static or declining salaries, and overwhelming debt burdens -- all of which have the potential to affect different aspects of well-being -- continue to challenge residents.
While trying to rebuild America's economy and decrease unemployment, finding resources to fund access to basic services, preventative healthcare, and quality education can be difficult. A long-term commitment by the public and private sector to focus on job growth and develop the economy may go a long way toward resolving overwhelming costs associated with economic recovery. Additionally, employers who take a holistic approach to employees' well-being, such as offering incentives to quit smoking or regularly attend a gym, can play a vital role in decreasing organizational and societal costs related to poor well-being.
Gallup's "State of the States" series reveals state-by-state differences on political, economic, and well-being measures Gallup tracks each day. New stories based on full-year 2011 data will be released throughout the month of February.Learn more about the Gallup-Healthways Well-Being Index.
Survey Methods
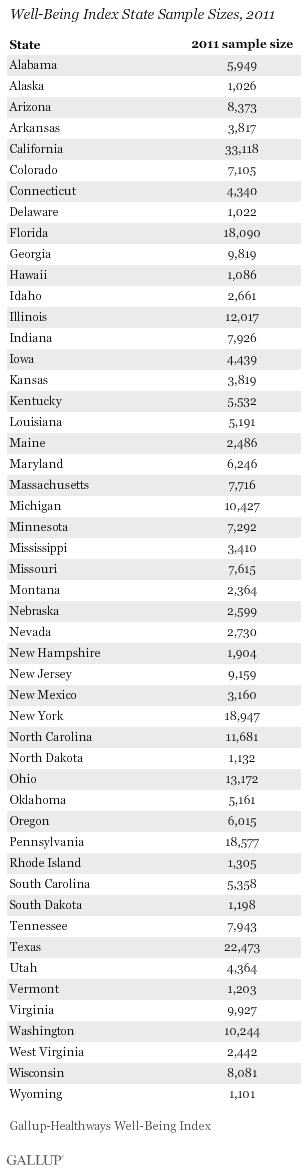
Results are based on telephone interviews conducted as part of the Gallup-Healthways Well-Being Index survey Jan. 2-Dec. 29, 2011, with a random sample of 353,492 adults, aged 18 and older, living in all 50 U.S. states and the District of Columbia, selected using random-digit-dial sampling.
For results based on the total sample of national adults, one can say with 95% confidence that the maximum margin of sampling error is ±1 percentage point.
The margin of sampling error for most states is ±1 to ±2 percentage points, but is as high as ±4 points for states with smaller population sizes such as Wyoming, North Dakota, South Dakota, Delaware, and Hawaii.
Interviews are conducted with respondents on landline telephones and cellular phones, with interviews conducted in Spanish for respondents who are primarily Spanish-speaking. Each sample includes a minimum quota of 400 cell phone respondents and 600 landline respondents per 1,000 national adults, with additional minimum quotas among landline respondents by region. Landline telephone numbers are chosen at random among listed telephone numbers. Cell phone numbers are selected using random-digit-dial methods. Landline respondents are chosen at random within each household on the basis of which member had the most recent birthday.
Samples are weighted by gender, age, race, Hispanic ethnicity, education, region, adults in the household, and phone status (cell phone only/landline only/both, cell phone mostly, and having an unlisted landline number). Demographic weighting targets are based on the March 2010 Current Population Survey figures for the aged 18 and older non-institutionalized population living in U.S. telephone households. All reported margins of sampling error include the computed design effects for weighting and sample design.
In addition to sampling error, question wording and practical difficulties in conducting surveys can introduce error or bias into the findings of public opinion polls.
For more details on Gallup's polling methodology, visit https://www.gallup.com/.