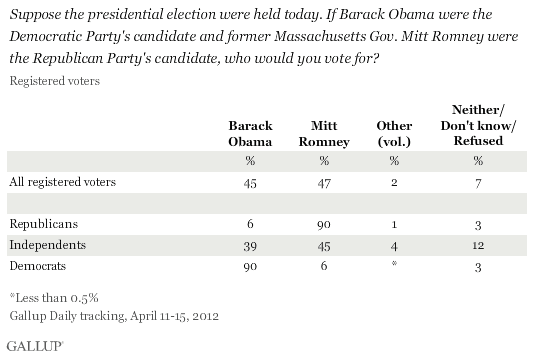
PRINCETON, NJ -- Mitt Romney is supported by 47% of national registered voters and Barack Obama by 45% in the inaugural Gallup Daily tracking results from April 11-15. Both Obama and Romney are supported by 90% of their respective partisans.
These results are the first from Gallup Daily tracking of registered voters' general election preferences, which began on April 11 and will be reported daily on Gallup.com on the basis of continuous five-day rolling averages. This initial report is based on interviews with 2,265 registered voters, and highlights the potential closeness of this year's race, with Romney and Obama essentially in a statistical tie. Gallup's previous general election trial heat, from a national poll conducted March 25-26, showed Obama with a slight 49% to 45% lead over Romney.
Gallup began tracking the general election on Wednesday, April 11, after Rick Santorum suspended his campaign for the Republican nomination, making Romney the all-but-assured GOP nominee.
The race breaks down into the expected patterns by party, with 90% of Democrats supporting Obama, and 90% of Republicans supporting Romney. The Republican results show that despite the rancor and divisiveness of the Republican campaign, the vast majority of Republicans are backing Romney in the head-to-head battle with Obama, as they have in ballot tests earlier this year.
The crucial voting bloc of independents breaks toward Romney by 45% to 39%, giving the GOP challenger his slight overall edge.
Republicans and Democrats Have Similar Certain to Vote Scores
In any close presidential election, motivation and turnout are keys. Gallup will report the projected vote based on the smaller segment of likely voters as the election nears next fall, but in the current tracking has included one "likely voter" question that provides a rough indicator of turnout potential -- asking registered voters to self-report their certainty of voting in the November election.
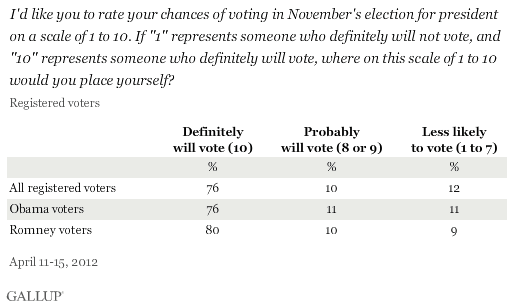
At this point, there is no statistically significant advantage for either candidate, as 80% of Romney voters and 76% of Obama voters say they will definitely vote next November.
Bottom Line
History shows that the candidates' positioning in the spring of an election year is not necessarily good at forecasting the election outcomes. For example, in an April 20-22, 1992, Gallup poll, incumbent President George H.W. Bush was ahead with 41% of the vote, compared with 26% for Bill Clinton and 25% for Ross Perot. And in an April 11-14, 1980, poll, incumbent President Jimmy Carter led Ronald Reagan by 42% to 34%, with John Anderson receiving 18% support. Both Bush and Carter, of course, ultimately lost their re-election bids.
Still, the current results, and the results that will follow as Gallup tracks the race on a daily basis, provide an excellent, scientific way to understand the dynamics of the election campaign, and the impact of foreseen and unforeseen events in the weeks and months ahead. And, at this point, the results show that the 2012 presidential election is shaping up to be a close race.
Survey Methods
Results are based on telephone interviews conducted as part of Gallup Daily tracking survey April 11-15, 2012, with a random sample of 2,265 registered voters, aged 18 and older, living in all 50 U.S. states and the District of Columbia.
For results based on the total sample of registered voters, one can say with 95% confidence that the maximum margin of sampling error is ±3 percentage points.
Interviews are conducted with respondents on landline telephones and cellular phones, with interviews conducted in Spanish for respondents who are primarily Spanish-speaking. Each sample includes a minimum quota of 400 cell phone respondents and 600 landline respondents per 1,000 national adults, with additional minimum quotas among landline respondents by region. Landline telephone numbers are chosen at random among listed telephone numbers. Cell phone numbers are selected using random-digit-dial methods. Landline respondents are chosen at random within each household on the basis of which member had the most recent birthday.
Samples are weighted by gender, age, race, Hispanic ethnicity, education, region, adults in the household, and phone status (cell phone only/landline only/both, cell phone mostly, and having an unlisted landline number). Demographic weighting targets are based on the March 2011 Current Population Survey figures for the aged 18 and older non-institutionalized population living in U.S. telephone households. All reported margins of sampling error include the computed design effects for weighting and sample design.
In addition to sampling error, question wording and practical difficulties in conducting surveys can introduce error or bias into the findings of public opinion polls.
For more details on Gallup's polling methodology, visit www.gallup.com.
