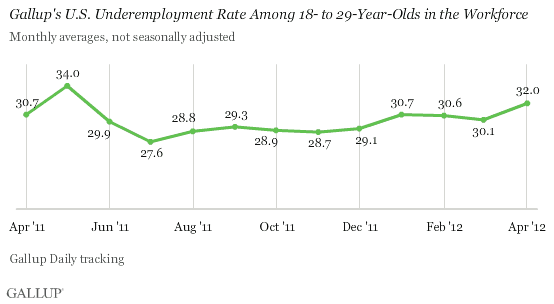
PRINCETON, NJ -- Thirty-two percent of 18- to 29-year-olds in the U.S. workforce were underemployed in April, as measured by Gallup without seasonal adjustment. This is up from 30.1% in March and is slightly higher than the 30.7% of a year ago.
These results are based on Gallup Daily tracking interviews, conducted with 28,215 Americans throughout April, including 2,864 respondents aged 18 to 29.
Gallup's U.S. underemployment measure combines the unemployed with those working part time but looking for full-time work. Underemployment among 18- to 29-year-olds has hovered around 30% for most of the past year, showing no real improvement. Underemployment among all Americans has declined over the past year to 18.2% in April from 19.3% in April 2011.
Young adults were more than twice as likely as those in older age groups to be underemployed in April. Underemployment in April was 14.0% among those aged 30 to 49, 13.6% among those aged 50 to 64, and 12.7% among those 65 or older.

Unemployment Also Remains Stubbornly High Among Young Adults
Unemployment among young adults, as measured by Gallup without seasonal adjustment, increased to 13.6% in April, up from 12.5% in March and the same as in April 2011. Overall unadjusted unemployment declined slightly to 8.3% in April from 8.4% in March.
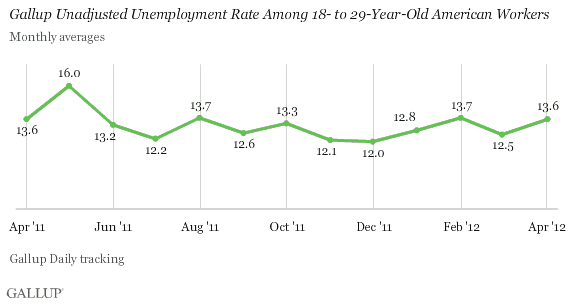
Young adults continue to be much more likely than average to be unemployed; their 13.6% rate in April compares with 7.0% in the 30 to 49 age group, 6.2% among those aged 50 to 64, and 4.9% among those 65 or older.
More Now Than at Any Time in Past Year Working Part Time, Looking for Full-Time Job
Another 18.4% of young adults in the workforce were working part time but wanting to work full time in April. This is up from 17.5% in March and 17.1% in April a year ago, and is the highest percentage of part-time young employees looking for full-time work seen during the past year.
Those in the 30 to 49 (7.0% working part time, but want full-time work), 50 to 64 (7.4%), and 65 and older (7.7%) age groups are much less likely to fall into this part of the workforce.
Implications
Wall Street has generally viewed the government's unemployment report for April as a negative for the U.S. economy. Gallup's unemployment measures show that April has also brought gloomy job news for young Americans and underscores that this group has been struggling disproportionately for some time. Those aged 18 to 29 are more than twice as likely as those in any other age group to be underemployed.
Additionally, while the unemployment rate among young adults in April is unchanged year over year, the underemployment rate has increased. A larger percentage of younger American workers are working part time but looking for full-time work today than were doing so in April 2011. That is, employers appear to be hiring younger Americans in greater numbers on a part-time basis this year than last, possibly in response to the current high level of economic uncertainty.
Not surprisingly, given their relative lack of resources and experience, only 3.1% of young adults in April say they are self-employed. This compares with the 7.3% of all Americans in the workforce who report being self-employed. Thus, self-employment is also a job alternative that is less available to younger, less experienced Americans.
Today's slow economic growth is a disaster for those unemployed and underemployed as they look for jobs when so few new jobs are being created. For younger Americans as a group, this is a particularly acute issue. Nearly one in three young adults in the workforce are not now able to gain full-time job experience. This not only hurts them temporarily, but deprives them of the experience they need to get a better job in the future. It also deprives U.S. companies of the skilled and experienced workers they will need for their businesses to prosper in the years ahead.
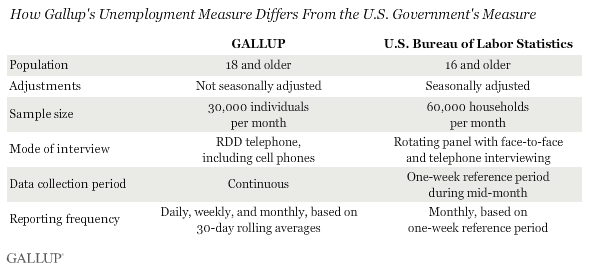
Gallup.com reports results from these indexes in daily, weekly, and monthly averages and in Gallup.com stories. Complete trend data are always available to view and export in the following charts:
Daily: Employment, Economic Confidence, Job Creation, Consumer Spending
Weekly: Employment, Economic Confidence, Job Creation, Consumer Spending
Read more about Gallup's economic measures.
View our economic release schedule.
Survey Methods
Results are based on telephone interviews conducted as part of Gallup Daily tracking from April 1-30, 2012, with a random sample of 28,215 adults, aged 18 and older, living in all 50 U.S. states and the District of Columbia, selected using random-digit-dial sampling.
For results based on the total sample of national adults, one can say with 95% confidence that the maximum margin of sampling error is ±1 percentage point.
Results for younger Americans 18 to 29 are based on telephone interviews conducted as part of Gallup Daily tracking from April 1-30, 2012, with a random sample of 2,864 adults, living in all 50 U.S. states and the District of Columbia, selected using random-digit-dial sampling.
For results based on the total sample of national adults, one can say with 95% confidence that the maximum margin of sampling error is ±3 percentage points.
Interviews are conducted with respondents on landline telephones and cellular phones, with interviews conducted in Spanish for respondents who are primarily Spanish-speaking. Each sample includes a minimum quota of 400 cell phone respondents and 600 landline respondents per 1,000 national adults, with additional minimum quotas among landline respondents by region. Landline telephone numbers are chosen at random among listed telephone numbers. Cell phone numbers are selected using random-digit-dial methods. Landline respondents are chosen at random within each household on the basis of which member had the most recent birthday.
Samples are weighted by gender, age, race, Hispanic ethnicity, education, region, adults in the household, and phone status (cell phone only/landline only/both, cell phone mostly, and having an unlisted landline number). Demographic weighting targets are based on the March 2011 Current Population Survey figures for the aged 18 and older non-institutionalized population living in U.S. telephone households. All reported margins of sampling error include the computed design effects for weighting and sample design.
In addition to sampling error, question wording and practical difficulties in conducting surveys can introduce error or bias into the findings of public opinion polls.
For more details on Gallup's polling methodology, visit www.gallup.com.
