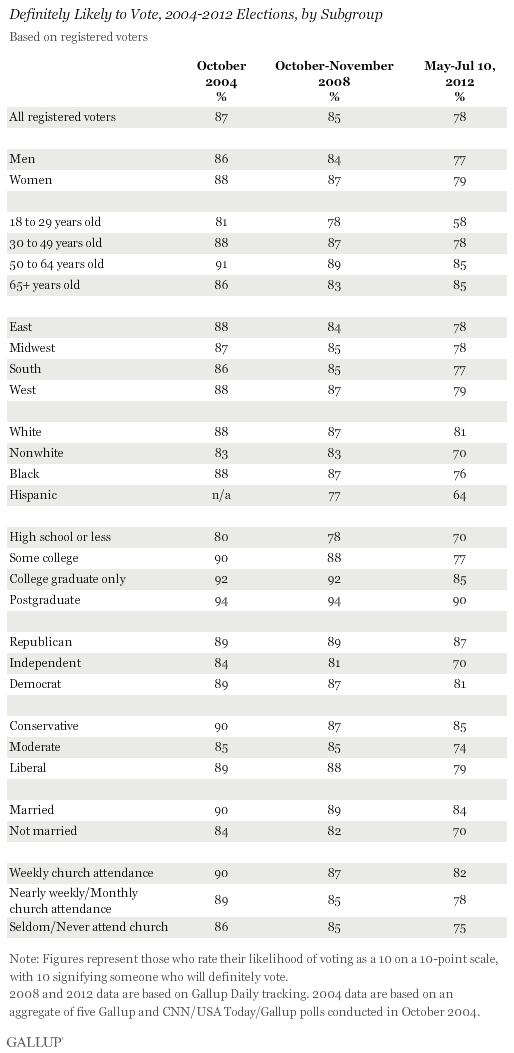
PRINCETON, NJ -- Fifty-eight percent of U.S. registered voters aged 18 to 29 say they will "definitely vote" this fall, well below the current national average of 78% and far below 18- to 29-year-olds' voting intentions in the fall of 2004 and 2008. The 20-percentage-point deficit for young voters versus the national average compares unfavorably with six- and seven-point deficits in the later stages of the 2004 and 2008 elections, respectively.
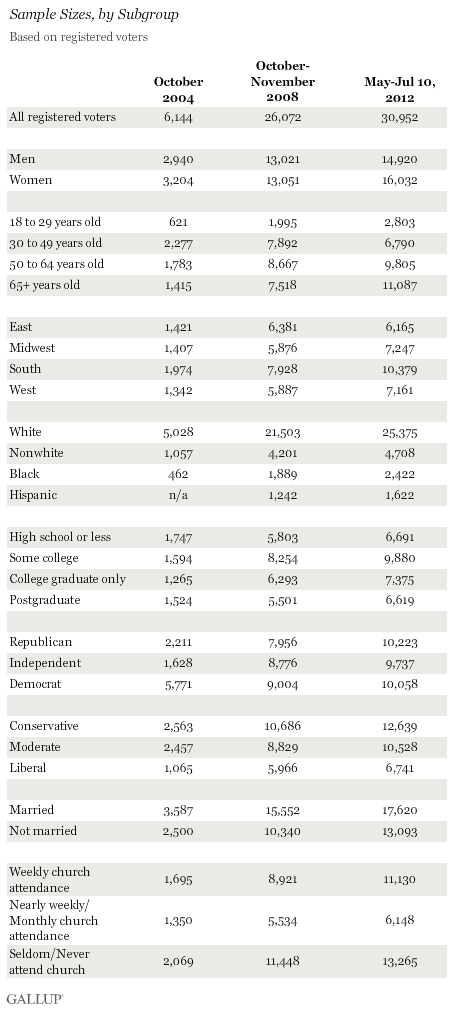
These results are based on an analysis of May 1-July 10 Gallup Daily tracking interviews with more than 30,000 registered voters, and more than 2,800 18- to 29-year-old registered voters. In addition to asking presidential vote preferences, Gallup asks registered voters to rate their chances of voting on a 10-point scale, with "10" indicating they will "definitely vote." This analysis reports the percentage of voters who say they will definitely vote. The question is asked as part of Gallup's larger likely voter scale that will be used in the fall.
Turnout intentions are currently lower among all registered voters than they were in the month before the last two elections, with 78% saying they will definitely vote, compared with figures of at least 85% in October/November 2004 and 2008. This partly reflects the normal pattern in which fewer voters say they will definitely vote in the late spring and early summer months than in the fall of an election year. However, a comparison of similarly timed data in the 2004 and 2008 elections still suggests turnout levels this year may not match those from the last two elections. In June 2004 (80%) and June 2008 (82%), slightly more registered voters said they would definitely vote than the 78% who do so now.
Young voters were one of the key groups in President Obama's winning 2008 coalition. They widely support the president this year as well, but historically their turnout levels usually lag behind those of other groups. Thus, the question surrounding young voters is not so much whom they will support as whether they will officially register that support in the voting booth.
The 20-point deficit in turnout intentions for young voters compared with the current national average is the largest among major demographic subgroups. A table showing the full data on each subgroup can be found on page 2.
If history is a guide, young voters should become more likely to say they will definitely vote between now and the fall, as occurred in 2004 and 2008. These increases were much larger than the national increases in those years, suggesting young voters decide whether they will actually vote later than most voters do.
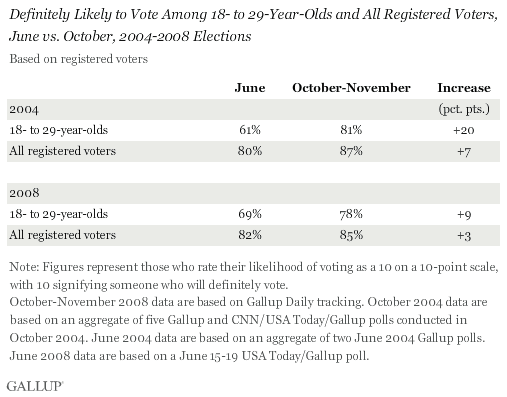
Even with the increases, however, young voters ended up significantly below the national averages in voting intention by the time of the election. Thus, young voters' vote intention deficit will likely shrink in the coming months, but there would need to be a larger increase than occurred in 2004 and 2008 to indicate their turnout levels might match those from the last two elections.
Black Turnout Intentions Similar to National Average
Racial and ethnic minorities are another subgroup whose higher turnout in 2008 helped Obama win the presidency. This is especially true for blacks, whose support for Obama exceeded 90%. The percentage of blacks who say they will definitely vote is similar to the national average this year (76% versus 78%), as it was in prior years. However, as with most other groups, it is lower now than it was in the fall of 2004 and 2008.
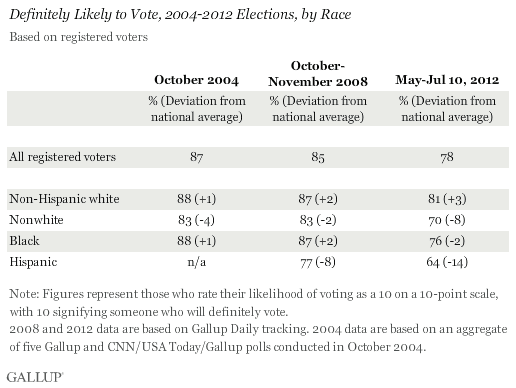
It is unclear whether the percentage of black registered voters who say they will definitely vote will increase significantly over the course of the campaign, as occurred for young voters in the past two campaigns. In June 2008, 84% of black registered voters said they would definitely vote, compared with 87% at the end of the campaign, suggesting little change over time. In 2004, however, black voting intentions did increase significantly from June (78%) to October (88%).
Hispanic registered voters, who currently support Obama by more than a 2-to-1 margin, are, along with 18- to 29-year-olds, one of the groups with the lowest expected turnout. Currently, 64% of Hispanic voters say they will definitely vote, 14 points below the national average. In the fall of 2008, Hispanic turnout intentions were eight points below the national average. Gallup does not have data on Hispanic turnout intentions prior to October 2008, so it is unclear how the current figures compare to the summer of 2004 or 2008.
Implications
With Obama maintaining just a slight advantage over Mitt Romney in registered voters' presidential preferences, the election result could be decided by turnout. The challenge for Obama is that many of his strongest support groups, including young adults, blacks, and Hispanics, have historically turned out to vote at lower rates than other subgroups. So maintaining a relatively high level of turnout among these groups is a key to Obama's winning a second term.
It is important to note that the 10-point voting intention scale used here is just one of seven items Gallup uses to assess likelihood to vote in its likely voter model. So even though this single item does provide an indication of potential turnout among subgroups at this early stage in the campaign, Gallup will have a better sense in the fall when it begins using the full likely voter scale.
This preliminary look at the data suggests young voters will not turn out at the same rate as in 2008, even if they show an expected increase in voting intention over the course of the campaign. Black turnout appears as though it will be similar to that for all voters, though participation among Hispanics could be lower. Turnout among all voters in 2012 may also be lower than in the past two presidential elections, both of which had above-average turnout from a historical perspective.
Track every angle of the presidential race on Gallup.com's Election 2012 page.
Survey Methods
Results are based on telephone interviews conducted as part of Gallup Daily tracking May 1-July 10, 2012, with a random sample of 30,952 registered voters, aged 18 and older, living in all 50 U.S. states and the District of Columbia.
For results based on the total sample of registered voters, one can say with 95% confidence that the maximum margin of sampling error is ±1 percentage point.
For results based on the total sample of 2,803 registered voters aged 18 to 29, one can say with 95% confidence that the maximum margin of sampling error is ±2 percentage points.
For results based on the total sample of 2,422 black registered voters, one can say with 95% confidence that the maximum margin of sampling error is ±2 percentage points.
For results based on the total sample of 1,622 Hispanic registered voters, one can say with 95% confidence that the maximum margin of sampling error is ±3 percentage points.
Interviews are conducted with respondents on landline telephones and cellular phones, with interviews conducted in Spanish for respondents who are primarily Spanish-speaking. Each sample includes a minimum quota of 400 cell phone respondents and 600 landline respondents per 1,000 national adults, with additional minimum quotas among landline respondents by region. Landline telephone numbers are chosen at random among listed telephone numbers. Cell phone numbers are selected using random-digit-dial methods. Landline respondents are chosen at random within each household on the basis of which member had the most recent birthday.
Samples are weighted by gender, age, race, Hispanic ethnicity, education, region, adults in the household, and phone status (cell phone only/landline only/both, cell phone mostly, and having an unlisted landline number). Demographic weighting targets are based on the March 2011 Current Population Survey figures for the aged 18 and older non-institutionalized population living in U.S. telephone households. All reported margins of sampling error include the computed design effects for weighting and sample design.
In addition to sampling error, question wording and practical difficulties in conducting surveys can introduce error or bias into the findings of public opinion polls.
For more details on Gallup's polling methodology, visit www.gallup.com.
