PRINCETON, NJ -- Twenty-eight percent of Americans are now satisfied with the way things are going in the country, up from 20% in June and roughly matching the highest levels recorded at various points since 2010, of either 26% or 27%. Satisfaction has dipped much lower during this time period, but the last time satisfaction was statistically higher was in mid-2009.
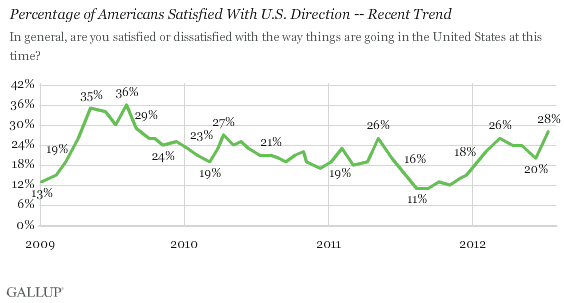
Most Americans -- 69% -- remain dissatisfied with the way things are going in the U.S. according to the July 9-12 Gallup poll; however, this is the first time since 2009 that the figure has registered below 70%.
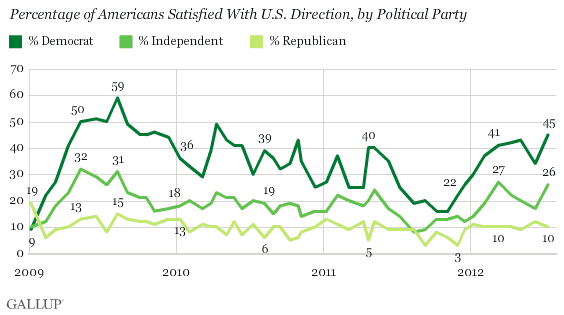
Democrats' satisfaction increased to 45% in July, up from 34% in June, but similar to the 43% seen in May. Independents' satisfaction also increased, rising to 26%, from 17% in June and 20% in May. But, Republicans' satisfaction was statistically unchanged at 10%.
Americans are significantly more satisfied today than they were in January 2009, just before Barack Obama took office. At that time, 13% were satisfied. The percentage satisfied surged to 36% within the first seven months of his administration, but gradually fell to the mid-20s and has since averaged 21%, with a period of lower ratings in the second half of 2011. Today's 28% thus marks an encouraging departure from the norm seen over the past three years.
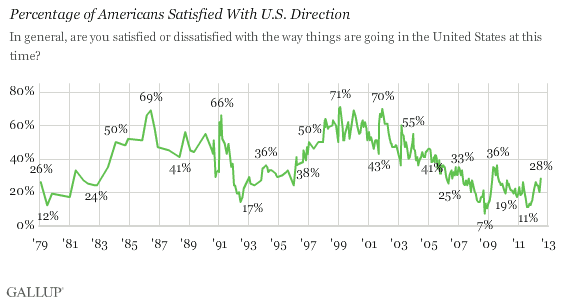
Longer term, U.S. satisfaction is well below the historical high points occasionally recorded since Gallup instituted this measure in 1979. It is also lower than the 41% who were satisfied in July 2004 under George W. Bush, and the 38% satisfied in August 1996 under Bill Clinton -- both measures taken in advance of those incumbents winning re-election -- but higher than the 17% satisfied in July 1992 under George H.W. Bush, who lost.
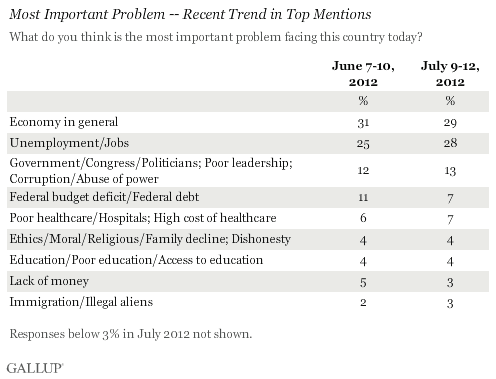
Americans Still See Economic Issues as Most Important U.S. Problem
Americans continue to focus on economic issues as the most important problems facing the country, despite the increase this month in satisfaction with the direction of the country. The economy in general, and unemployment or jobs, specifically, continue to lead the least, named by 29% and 28% of Americans, respectively. Dissatisfaction with government/politicians ranks third, now at 13%, followed by the federal budget deficit and healthcare, tied at 7%.
Bottom Line
While still negative, Americans' overall view of the direction of the country improved in the past month, with the percentage satisfied rising to 28% from 20% in June. Satisfaction is up because of a rebound among Democrats and independents, after their satisfaction levels dipped in June. However, the reason for this isn't entirely clear.
Over the same period, the Gallup Economic Confidence Index worsened slightly, from -20 for the week ending June 10 to -27 for the week ending July 15. In those same weeks, President Obama's job approval ratings were 47% and 46%, respectively -- largely unchanged. And Americans' views on the most important problem facing the country were steady in July -- still focused on economic issues.
Whether this month's increase in satisfaction is sustained in August could be important to President Obama's chances for re-election given that, at 28%, satisfaction is now better than the level seen in 1992 (17%) in advance of George H.W. Bush losing his re-election bid. Thus Obama may be above the danger zone for incumbents in terms of national mood. However, it is not yet as high as Gallup found in 1996 and 2004 when Clinton and George W. Bush each won, thus Obama has not yet reached the apparent safety zone.
Survey Methods
Results for this USA Today poll are based on telephone interviews conducted July 9-12, 2012, on the Gallup Daily tracking survey, with a random sample of 1,014 adults, aged 18 and older, living in all 50 U.S. states and the District of Columbia.
For results based on the total sample of national adults, one can say with 95% confidence that the maximum margin of sampling error is ±4 percentage points.
Interviews are conducted with respondents on landline telephones and cellular phones, with interviews conducted in Spanish for respondents who are primarily Spanish-speaking. Each sample includes a minimum quota of 400 cell phone respondents and 600 landline respondents per 1,000 national adults, with additional minimum quotas among landline respondents by region. Landline telephone numbers are chosen at random among listed telephone numbers. Cell phones numbers are selected using random digit dial methods. Landline respondents are chosen at random within each household on the basis of which member had the most recent birthday.
Samples are weighted by gender, age, race, Hispanic ethnicity, education, region, adults in the household, and phone status (cell phone-only/landline only/both, cell phone mostly, and having an unlisted landline number). Demographic weighting targets are based on the March 2011 Current Population Survey figures for the aged 18 and older non-institutionalized population living in U.S. telephone households. All reported margins of sampling error include the computed design effects for weighting and sample design.
In addition to sampling error, question wording and practical difficulties in conducting surveys can introduce error or bias into the findings of public opinion polls.
View methodology, full question results, and trend data.
For more details on Gallup's polling methodology, visit https://www.gallup.com/.
