PRINCETON, NJ -- A slim majority of Americans, 52%, approve of labor unions, unchanged from 2010 and 2011, and up only slightly from the all-time low of 48% in 2009. Americans had been far more approving of unions before 2009 than they have in the last few years.
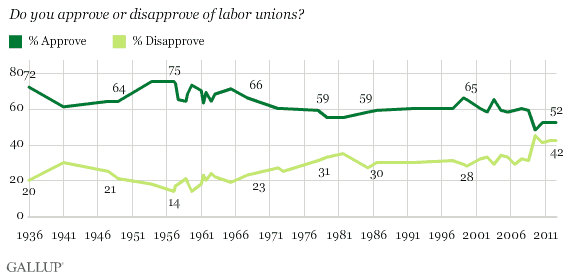
Gallup first asked Americans whether they approved of labor unions in 1936, and 72% did at that time. Labor union approval peaked at 75% in January 1957, and remained above 60% until 1978. Approval held just below 60% through 1991, and generally hovered around the 60% mark through 2008. The drop in approval to 48% occurred in 2009, the first year of Obama's presidency and after the 2008-2009 financial crisis and recession.
Union approval has always varied by party. Currently, 74% of Democrats, 48% of independents, and 31% of Republicans say they approve of unions.
Americans Prefer That Unions Have Less Influence Rather Than More
The decline in union approval in recent years has been accompanied by an increase in the percentage of Americans who prefer that unions have less influence in the future. At least 40% have held this view since 2009, including 41% this year. Prior to 2009, only as many as 32% wanted to see unions be less influential.
![Trend: Would you, personally, like to see labor unions in the United States have -- [ROTATED: more influence than they have today, the same amount as today, (or) less influence than they have today]?](http://content.gallup.com/origin/gallupinc/GallupSpaces/Production/Cms/POLL/pmu9rrtp_uw2lcysswxjfq.gif)
From 1999 to 2004, Americans' most common preference was for unions to have the same amount of influence, and from 2005 to 2008, it was for unions to have more influence.
The majority of Americans predict labor unions will become weaker in the future, as was the case last year. That has always been the most common view, but had reached the majority level only one time before last year. Currently, 21% believe unions will be stronger in the future, and 22% predict no change in their strength.
![Trend: Thinking about the future, do you think labor unions in this country will become -- [ROTATED: stronger than they are today, the same as today, (or) weaker than they are today]?](http://content.gallup.com/origin/gallupinc/GallupSpaces/Production/Cms/POLL/n19tgfalfeaja0rju_ooaw.gif)
The poll finds 10% of Americans personally belonging to a labor union, and 17% living in a household with a union member. Those figures have generally been stable the last 10 years.
Implications
Americans continue to be more likely to approve than disapprove of labor unions, but the level of approval remains historically low, as it has been since 2009. Similarly, the public has seemed to shift toward a preference for unions to be less influential in the future than they are today.
In the last two years, union rights have been in the news, with Wisconsin and other states limiting public-sector union members' benefits, if not the scope of what they are able to bargain for in new contracts. That news appears to have done little to change the way Americans view unions, since much of the decline in union approval preceded that, and views have been stable since.
The drop in union support has come during a down economy, spanning a transition from a less union-friendly presidential administration to a more friendly one, and a time of increasing pressure on unions to scale back employee and retiree health benefits and retirement plans.
Survey Methods
Results for this Gallup poll are based on telephone interviews conducted Aug. 9-12, 2012, with a random sample of 1,012 adults, aged 18 and older, living in all 50 U.S. states and the District of Columbia.
For results based on the total sample of national adults, one can say with 95% confidence that the maximum margin of sampling error is ±4 percentage points.
Interviews are conducted with respondents on landline telephones and cellular phones, with interviews conducted in Spanish for respondents who are primarily Spanish-speaking. Each sample includes a minimum quota of 400 cell phone respondents and 600 landline respondents per 1,000 national adults, with additional minimum quotas among landline respondents by region. Landline telephone numbers are chosen at random among listed telephone numbers. Cell phone numbers are selected using random-digit-dial methods. Landline respondents are chosen at random within each household on the basis of which member had the most recent birthday.
Samples are weighted by gender, age, race, Hispanic ethnicity, education, region, adults in the household, and phone status (cell phone only/landline only/both, cell phone mostly, and having an unlisted landline number). Demographic weighting targets are based on the March 2011 Current Population Survey figures for the aged 18 and older non-institutionalized population living in U.S. telephone households. All reported margins of sampling error include the computed design effects for weighting and sample design.
In addition to sampling error, question wording and practical difficulties in conducting surveys can introduce error or bias into the findings of public opinion polls.
View methodology, full question results, and trend data.
For more details on Gallup's polling methodology, visit www.gallup.com.
