PRINCETON, NJ -- Mitt Romney holds a slight edge over Barack Obama -- 49% to 47% -- in Gallup's initial "likely voter" estimate, encompassing interviews from Oct. 2-8. Preferences tilt the opposite way among registered voters, 49% vs. 46% in Obama's favor.
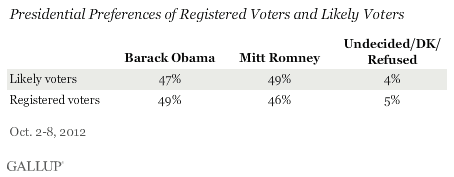
Neither result provides a candidate with a statistically significant lead, but together they do underscore the competitive nature of the election and indicate that Romney at this point benefits from turnout patterns, given the five-point swing in his favor when the transition is made from registered voters to likely voters.
As is almost always the case in recent elections, likely voters at this point are more likely to support the Republican candidate than are all registered voters. Gallup's estimate of the vote choices of likely voters shows that Romney gains three percentage points among likely voters compared with the total registered voter pool, and Obama loses two points.
The calculation of likely voters is based on registered voters' responses to a seven-question series that -- with some revisions along the way -- Gallup has used since 1952 to calculate voters' likelihood of voting. In some years, such as 2008, there was only a marginal difference between the vote choices of registered voters and likely voters. In others, such as 1996, there was a much more substantial difference.
At this point, Romney voters are somewhat more likely to respond that they will definitely vote, that they have thought a lot about the election, and that they are more familiar with where people in their local area vote. These attitudes indicate that Romney at this juncture will benefit from higher turnout on Election Day among his supporters than will Obama. These patterns could change closer to Election Day as more voters become engaged or if Republicans' or Democrats' enthusiasm for voting is altered by campaign events.
Gallup started tracking likely voters' preferences on Oct. 1 and will continue to report daily both registered voter and likely voter results in seven-day rolling averages leading up to the election.
Obama Coming Back Among Registered Voters
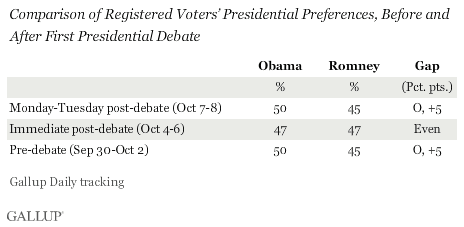
Obama's slight 49% to 46% seven-day lead among registered voters is just about where it was in the seven days prior to the debate. This trend suggests that Romney's impressive debate performance -- 72% of debate watchers said he did the better job -- may not have a lasting impact. Additionally, Friday's generally positive jobs report from the government, showing that unemployment fell below 8% for the first time since January 2009, may have helped Obama's standing.
Although Gallup's main focus is on seven-day rolling averages, a breakdown of interviewing over shorter periods can be helpful in understanding the short-term impact of events like conventions and debates. As Gallup reported Monday, Romney gained ground among registered voters in the immediate aftermath of his Oct. 3 debate, moving from a five-point deficit prior to the debate to a tie in the three days that immediately followed. Most of that gain was driven by substantial Romney leads in the Thursday and Friday tracking.
Since Saturday, however, Obama has regained a 50% to 45% edge among registered voters in interviewing conducted Sunday and Monday -- the same as his margin in the three days prior to the debate. Although these two days of interviewing involve relatively small sample sizes, they suggest that Romney's debate "bounce" may be fading.
Implications
Several things are apparent from a careful analysis of Gallup Daily tracking of voters' views of the election. First, the registered voter trends suggest that Romney's initial gains from his strong performance in last week's debate may be short-lived. Second, Gallup's inaugural likely voter results suggest that Romney at this point appears to have a turnout advantage, meaning that Obama will need to develop a strong lead among all registered voters in order to be assured of winning the actual popular vote. All in all, if the election were held today, Gallup's analysis suggests that the race would be too close to call.
Survey Methods
Results for this Gallup poll are based on telephone interviews conducted Oct. 2-8, 2012, on the Gallup Daily tracking survey, with a random sample of 3,214 registered voters and 2,721 likely voters, aged 18 and older, living in all 50 U.S. states and the District of Columbia.
For results based on the total sample of registered voters, one can say with 95% confidence that the maximum margin of sampling error is ±2 percentage points. For results based on the total sample of likely voters, one can say with 95% confidence that the maximum margin of sampling error is ±2 percentage points.
Interviews are conducted with respondents on landline telephones and cellular phones, with interviews conducted in Spanish for respondents who are primarily Spanish-speaking. Each sample includes a minimum quota of 250 cell phone respondents and 250 landline respondents per 500 national adults, with additional minimum quotas among landline respondents by region. Landline telephone numbers are chosen at random among listed telephone numbers. Cell phone numbers are selected using random-digit-dial methods. Landline respondents are chosen at random within each household on the basis of which member had the most recent birthday.
Samples are weighted by gender, age, race, Hispanic ethnicity, education, region, adults in the household, population density, and phone status (cell phone only/landline only/both, cell phone mostly, and having an unlisted landline number). Demographic weighting targets are based on the March 2011 Current Population Survey figures for the aged 18 and older non-institutionalized U.S. population. All reported margins of sampling error include the computed design effects for weighting.
In addition to sampling error, question wording and practical difficulties in conducting surveys can introduce error or bias into the findings of public opinion polls.
For more details on Gallup's polling methodology, visit www.gallup.com.
