PRINCETON, NJ -- Eighteen percent of Americans approve of the job Congress is doing, down slightly from 21% shortly before the election. But approval is still improved over the record-low 10% readings Gallup recorded earlier in 2012, as recently as August.
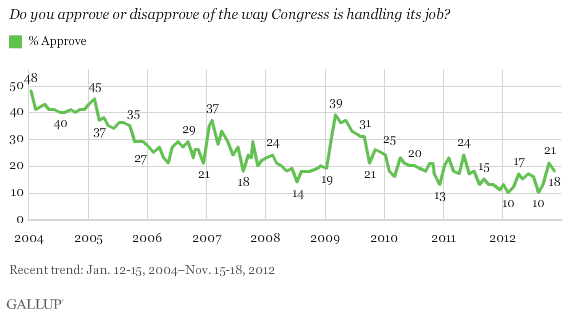
More broadly, public approval of Congress has not reached 25% since December 2009, and has typically been below 20%, averaging 17% since January 2010. That compares with an average 34% approval rating for Congress across Gallup's full trend, starting in 1974.
Republicans and Democrats Equally Negative About Congress
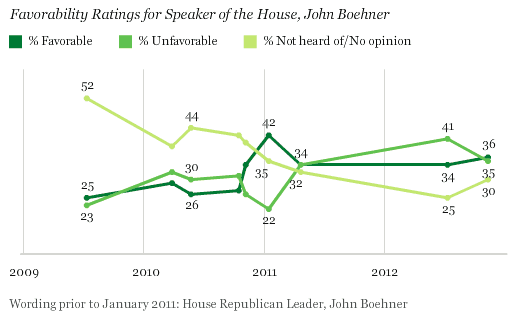
Republicans, Democrats, and independents are about equally negative toward Congress in the Nov. 15-18 Gallup poll. But, Democrats' approval is down 11 points from October's 30% reading, which in turn was up from 16% in September. Republicans' approval had also spiked before the election, rising eight points to 20% in October from 12% in September.
Rank-and-file Republicans and Democrats have given similarly low ratings to Congress since party control of Congress became divided at the start of 2011. By contrast, in 2009 and 2010, when Democrats held the majority in both houses of Congress, approval was significantly higher among Democrats than among Republicans and independents.
Low Approval of Congress in October Typically Presages Relatively High Seat Change
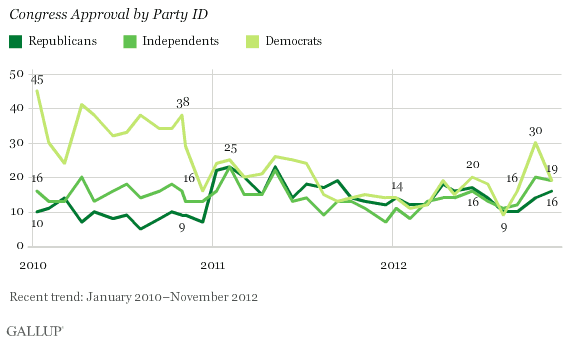
While retaining their majority status in the U.S. House of Representatives, Republicans are on track to lose eight seats in the November elections, reducing the number of Republican-held seats from 242 to 234 -- pending the outcome of a recount in one House election. Regardless of the precise outcome, the 2012 elections will produce a comparatively low party turnover, given Congress' 21% approval rating leading up to the election.
According to a recent Gallup analysis, in presidential and midterm election years when Congress' job approval rating just prior to the election was below 30%, a relatively high number of seats typically changed hands from one party to the other in the U.S. House.
The strongest examples of this are from 1980, 1994, 2006, 2008, and 2010, when the majority party lost between 23 and 63 seats. 2012 aligns more with 1992 and -- to a lesser extent -- 1976 and 1990, when, despite low congressional approval, the majority party lost no more than 10 seats.
Americans View Neither Speaker Boehner Nor Majority Leader Reid Net Favorably
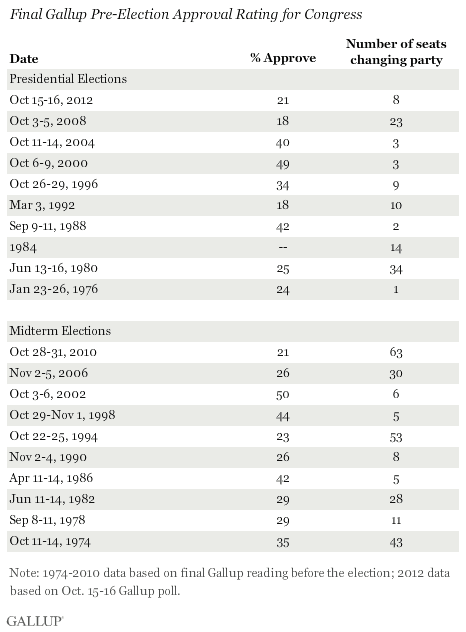
Underscoring that both political parties in Congress have image problems, neither Republican Speaker of the House John Boehner nor Democratic Senate Majority Leader Harry Reid is viewed favorably by a majority or even a significant plurality of Americans. However, of the two, Boehner's ratings are the more positive, with as many Americans viewing him favorably as unfavorably, 36% vs. 35%, respectively. This contrasts with a negative tilt to Reid's image, 28% favorable vs. 36% unfavorable.
Compared with the start of the 112th Congress in January 2011, Boehner is viewed less favorably today than he was then, while Reid's image has not changed much.
Bottom Line
At 18%, Congress approval remains squarely in the center of the low range seen since 2010, which is also low by long-term standards, since 1974. Partisan pre-election excitement may have boosted how Republicans and Democrats rated Congress, but this has receded somewhat, particularly among Democrats.
The division of power in Congress may contribute to Congress' low approval ratings -- giving neither party's rank-and-file members a political motive to defend the institution. Heightened partisan bickering and failure to cooperate on key legislative issues -- matters related to the pending fiscal cliff -- may also be a factor. However, the larger reason Americans are locked into a negative view of the Congress is likely the economy. As long as attitudes toward the U.S. job market -- and economic confidence, more broadly -- remain negative, Americans will assume Congress is not doing its job.
Survey Methods
Results for this Gallup poll are based on telephone interviews conducted Nov. 15-18, 2012, with a random sample of 1,015 adults, aged 18 and older, living in all 50 U.S. states and the District of Columbia.
For results based on the total sample of national adults, one can say with 95% confidence that the maximum margin of sampling error is ±4 percentage points.
Interviews are conducted with respondents on landline telephones and cellular phones, with interviews conducted in Spanish for respondents who are primarily Spanish-speaking. Each sample includes a minimum quota of 400 cellphone respondents and 600 landline respondents per 1,000 national adults, with additional minimum quotas among landline respondents by region. Landline telephone numbers are chosen at random among listed telephone numbers. Cellphone numbers are selected using random-digit-dial methods. Landline respondents are chosen at random within each household on the basis of which member had the most recent birthday.
Samples are weighted by gender, age, race, Hispanic ethnicity, education, region, adults in the household, population density, and phone status (cellphone only/landline only/both, cellphone mostly, and having an unlisted landline number). Demographic weighting targets are based on the March 2011 Current Population Survey figures for the aged 18 and older population living in U.S. All reported margins of sampling error include the computed design effects for weighting.
In addition to sampling error, question wording and practical difficulties in conducting surveys can introduce error or bias into the findings of public opinion polls.
View methodology, full question results, and trend data.
For more details on Gallup's polling methodology, visit www.gallup.com.
