PRINCETON, NJ -- There were more blue states than red states in the U.S. in 2012, by a margin of 20 to 12. After the District of Columbia, the most Democratic-leaning states in 2012 were Hawaii, Maryland, Rhode Island, New York, and Massachusetts -- where Democrats held at least 20-percentage-point advantages in party identification. Republicans enjoyed this lopsided an advantage in Utah, Wyoming, and Idaho.
Connecticut, Vermont, Illinois, and Delaware round out the top 10 most Democratic states. Thus, eight of the top 10 are located in the East.
The top 10 Republican states have a very different geographic profile, with three of the states located in the Midwest (North Dakota, Nebraska, and Kansas), two in the South (Alabama and Oklahoma), and five in the West. The full results by state appear on page 2.
These state and regional patterns closely mirror President Barack Obama's state-level job approval ratings in 2012.
Gallup determines the partisan orientation of each state by subtracting the total percentage of adults identifying as or leaning Republican from those identifying as Democrats or leaning Democratic, thus creating a "Democratic advantage" figure. Positive values indicate a state is more Democratic than Republican, while negative values indicate it is more Republican than Democratic.
The findings are based on Gallup Daily tracking from January through December 2012, encompassing interviews with more than 321,000 U.S. adults, including at least 1,000 in each of 47 states. Each state's data are weighted to match U.S. Census demographic parameters for that state's adult population.
On average in 2012 Gallup Daily tracking, 45% of all U.S. adults identified as Democrats or leaned Democratic and 41% identified as or leaned Republican. That compares with a 47% Democratic vs. 42% Republican split in party identification, according to aggregated Gallup and USA Today/Gallup stand-alone polls in 2012.
Democrats Pick Up One Net State in 2012, Republicans Lose Five
Fourteen states met the threshold for "solid Democratic" states in 2012, adding Michigan and Minnesota to the 12 that met that threshold in 2011. The Democrats had a net loss of one Democratic-leaning state, losing West Virginia and Kentucky (in addition to Michigan and Minnesota), but picking up Pennsylvania, Ohio, and Oregon. Thus, overall, 20 states were in the Democratic column in 2012, up from 19 in 2011, but still significantly fewer than Gallup found in 2008 and 2009.
In 2012, Republicans lost a total of five GOP-advantage states, including four Republican-leaning states (Indiana, Louisiana, Tennessee, and Texas) and one solid Republican state (South Dakota). While down from a total of 17 states in 2011, the Republicans' current 12 remains higher than in 2008 through 2010.
As a result of these various shifts, there were four more "competitive" states in 2012 than in 2011, for a total of 19 -- nearly double the number seen in Gallup's baseline year of 2008.
2008 was a recent high point for Democratic political identification, likely owing to the waning popularity of Republican President George W. Bush amid the economic crisis that erupted that year, and Barack Obama's ultimate appeal late in the presidential campaign. That year, Gallup found 36 states either solidly Democratic or leaning to the party, and only five solidly or leaning Republican. Those figures largely held in 2009, but started shifting in 2010, with fewer Democratic states and an increased number of Republican and competitive states. In 2011, the parties were at rough numerical parity, but in 2012, Democratic states once again outnumbered Republican states.
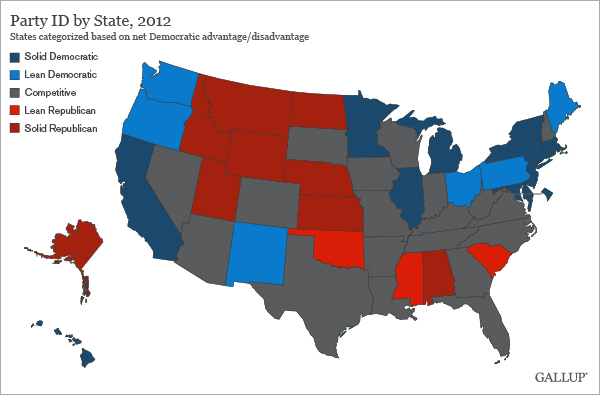
Red and Blue States Are Geographically Separate
Geographically, the partisan orientation of the states in 2012 shows Democrats maintaining a stronghold in the Northeast and on the Pacific Coast, while the Republicans do best in the center of the country and the South.
Of particular importance politically, six of the Democratic states are among the 10 most populous in the country: California, New York, Illinois, Pennsylvania, Ohio, and Michigan. By contrast, the most populous Republican state is Alabama, ranking 23rd in population. Although Texas has voted Republican in each of the past nine presidential elections, Gallup classifies it as competitive, given that slightly more of its residents identify as or lean Republican than Democratic.
Underscoring the regional separation of red and blue states, only six states share a border with a state oriented to the opposing party: Oregon and Washington, with Idaho; North Dakota with Minnesota; and New Mexico with Oklahoma -- with the last two barely qualifying.
Implications
While not perfectly correlated with voting patterns, the partisan makeup of the states illustrates the significant electoral challenge the Republican Party faced in 2012. It was strongest in the least populous parts of the country, particularly the Rocky Mountains and Midwest, and weakest in several of the largest states, such as California, New York, and Illinois. Thus, much of the 2012 presidential campaign was fought over highly competitive states such as Colorado, Florida, North Carolina, and Virginia. Whether that is repeated in 2016 will depend on whether the Democrats can hold or build on the gains made in 2012, or the Republicans are able to recapture the momentum they had in 2010 and 2011.
Gallup's "State of the States" series reveals state-by-state differences on political, economic, and well-being measures Gallup tracks each day. New stories based on full-year 2012 data will be released throughout the month of February.
Survey Methods
Results are based on telephone interviews conducted as part of Gallup Daily tracking Jan. 1-Dec. 31, 2012, with a random sample of 321,233 adults, aged 18 and older, living in all 50 U.S. states and the District of Columbia.
For results based on the total sample of national adults, one can say with 95% confidence that the maximum margin of sampling error is ±1 percentage point.
Margins of error for individual states are no greater than ±6 percentage points, and are ±3 percentage points in most states. The margin of error for the District of Columbia is ±6 percentage points.
Interviews are conducted with respondents on landline telephones and cellular phones, with interviews conducted in Spanish for respondents who are primarily Spanish-speaking. Each national sample includes a minimum quota of 400 cell phone respondents and 600 landline respondents per 1,000 national adults, with additional minimum quotas among landline respondents by region. Landline telephone numbers are chosen at random among listed telephone numbers. Cell phones numbers are selected using random digit dial methods. Landline respondents are chosen at random within each household on the basis of which member had the most recent birthday.
State samples are weighted to be representative of the state's adult population by gender, age, race, Hispanic ethnicity, and education based on the March 2012 Current Population Survey. All reported margins of sampling error include the computed design effects for weighting.
In addition to sampling error, question wording and practical difficulties in conducting surveys can introduce error or bias into the findings of public opinion polls.
For more details on Gallup's polling methodology, visit www.gallup.com.