PRINCETON, NJ -- Slightly more than a quarter of Americans, 27%, are satisfied with the way things are going in the United States today, while 72% are dissatisfied. Satisfaction this month is similar to the 25% Gallup found in January but up from 23% in December.
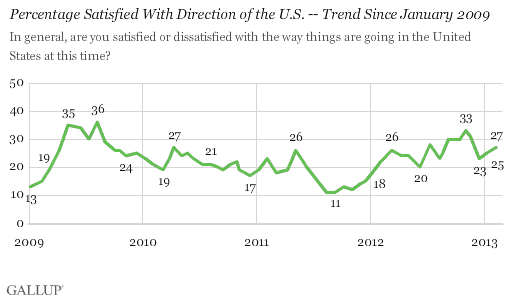
The latest results are from Gallup's annual World Affairs survey conducted Feb. 7-10 and the first measure since President Barack Obama took his second-term oath of office. The average level of satisfaction thus far in 2013 matches the 26% found for all of 2012, although it varied last year between 18% in January and 33% immediately before the November election.
The current level of satisfaction is significantly better than the 18% reading found at the start of Obama's first term in February 2009. Since then, satisfaction has never exceeded 37%, and in mid-2011, it briefly dipped to 11%. This contrasts with a long-term range of 71% for the high found in February 1999 and 7% for the low recorded in October 2008.
U.S. satisfaction has not been above 30% on a sustained basis since the first half of 2007. For satisfaction to break that pattern will partly depend on national economic conditions -- and therefore Americans' confidence in the economy -- significantly improving. The economy remains Americans' most pressing concern when it comes to national matters. Increasing satisfaction could also depend on narrowing the large partisan gap in ratings that has characterized public satisfaction levels for much of the past decade.
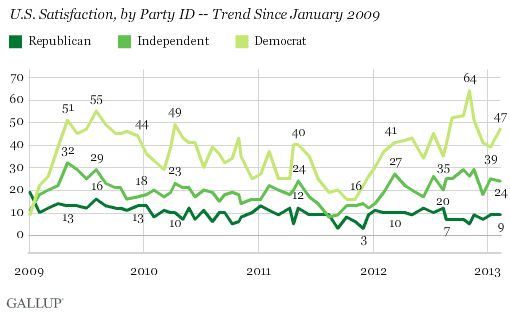
Democrats' Satisfaction Up, but Not Independents' or Republicans'
Currently, 47% of Democrats are satisfied with the direction of the country, up from 39% in January and the second highest recorded since early 2010. The high came during a brief period before the November 2012 election when Democrats' satisfaction surged.
By contrast, satisfaction among Republicans has been fairly flat over the past year and currently stands at 9%, 38 percentage points lower than Democrats'.
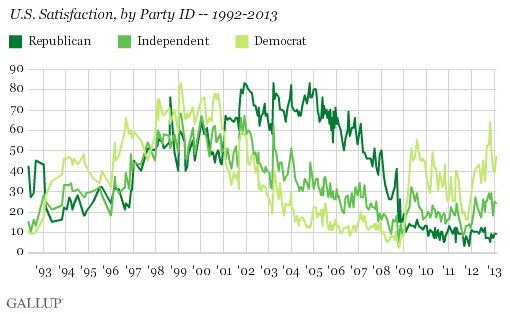
Democrats' and Republicans' satisfaction has differed by an average of 28 points during Obama's presidency, 38% vs. 10%, respectively. That is smaller than the 40-point gap seen during George W. Bush's eight years in office, from 2001-2009, when Republicans showed higher satisfaction, 61% vs. 21%, but greater than the average 18-point gap Gallup recorded during Bill Clinton's presidency from 1993-2001. In those years, 58% of Democrats were satisfied, on average, compared with 40% of Republicans.
Bottom Line
Americans remain mostly negative when it comes to their assessment of the direction of the country despite giving President Obama relatively positive job approval ratings, in the low 50s, thus far in his second term. Although better than during the last year of George W. Bush's presidency, the 26% of Americans currently satisfied with the direction of the country is similar to the public's mood throughout 2012 and barely above the average during Obama's presidency.
The slight improvement in satisfaction since December is the result of increased optimism among Democrats, with no increase in satisfaction among independents or Republicans. This type of partisan resistance to expressing satisfaction while the sitting president is a member of the opposing party was also seen during the George W. Bush presidency and could permanently suppress overall satisfaction if it persists.
Survey Methods
Results for this Gallup poll are based on telephone interviews conducted Feb. 7-10, 2013, with a random sample of 1,015 adults, aged 18 and older, living in all 50 U.S. states and the District of Columbia.
For results based on the total sample of national adults, one can say with 95% confidence that the margin of sampling error is ±4 percentage points.
Interviews are conducted with respondents on landline telephones and cellular phones, with interviews conducted in Spanish for respondents who are primarily Spanish-speaking. Each sample of national adults includes a minimum quota of 50% cell phone respondents and 50% landline respondents, with additional minimum quotas by region. Landline telephone numbers are chosen at random among listed telephone numbers. Cell phones numbers are selected using random digit dial methods. Landline respondents are chosen at random within each household on the basis of which member had the most recent birthday.
Samples are weighted to correct for unequal selection probability, nonresponse, and double coverage of landline and cell users in the two sampling frames. They are also weighted to match the national demographics of gender, age, race, Hispanic ethnicity, education, region, population density, and phone status (cellphone only/landline only/both, cellphone mostly, and having an unlisted landline number). Demographic weighting targets are based on the March 2012 Current Population Survey figures for the aged 18 and older U.S. population. Phone status targets are based on the July-December 2011 National Health Interview Survey. Population density targets are based on the 2010 census. All reported margins of sampling error include the computed design effects for weighting.
In addition to sampling error, question wording and practical difficulties in conducting surveys can introduce error or bias into the findings of public opinion polls.
View methodology, full question results, and trend data.
For more details on Gallup's polling methodology, visit https://www.gallup.com/.