WASHINGTON, D.C. -- Hawaii residents have the highest well-being in the nation for the fourth consecutive year, with a Gallup-Healthways Well-Being Index score of 71.1 in 2012 -- up from 70.2 in 2011. Colorado, Minnesota, Utah, and Vermont rounded out the top five states with the highest well-being scores last year. West Virginia residents have the lowest overall well-being for the fourth year in a row, with a Well-Being Index score of 61.3 in 2012 -- slightly lower than the 62.3 in 2011. Kentucky, Mississippi, Tennessee, and Arkansas also had among the five lowest well-being scores in the country.
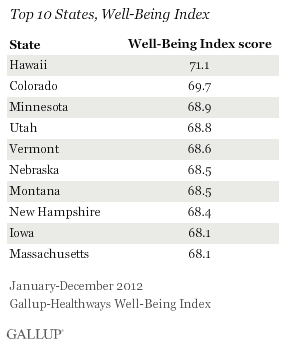
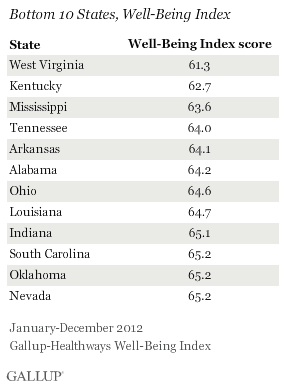
Overall, there were few changes from 2011 to 2012 in the states with the highest and lowest well-being scores. Seven states with the 10 highest well-being scores and eight states with the 10 lowest well-being scores in 2012 held those same distinctions in 2011. Vermont, Massachusetts, and Iowa joined the top 10 highest well-being states in 2012. Louisiana, Indiana, South Carolina, and Oklahoma newly rank among the bottom 10 states this year.
 |
| Explore complete state data > |
Western and Midwestern states earned seven of the 10 highest overall well-being scores, while New England states held the other three spots. Southern states had the six lowest well-being scores, and eight southern states were within the 10 lowest well-being scores. This regional pattern in well-being has remained consistent over the past five years.
In U.S., Overall Well-Being in 2012 on Par With Prior Years
The Well-Being Index score for the nation was 66.7 in 2012, similar 66.2 in 2011 and 66.8 in 2010. The six sub-index scores also remained similar in 2012 to 2011. The sub-index scores have not shown consistent year-over-year improvement over the past five years.
Top and Bottom States in Six Key Areas of Well-Being
Hawaii residents earned the highest scores in the nation on the Life Evaluation, Emotional Health, and Work Environment Indexes, which contributed to Hawaii maintaining its top position in overall well-being. In addition, Hawaii residents were most likely to rate their lives highly enough to be "thriving," earning them the highest Life Evaluation score in the nation. Residents living in Hawaii were most likely to experience daily enjoyment and least likely to have daily worry or stress, which contributed to their high emotional health.
Hawaii workers also reported having the most positive work environments in the nation, while Rhode Island employees reported having the most negative work environments. The Work Environment Index measures workplace issues such as whether a worker has a trusting and open work environment and whether an employee is able to use his or her strengths to do what he or she does best every day.
West Virginians were the least likely to be thriving, as was the case in 2011. Also, West Virginians had the worst emotional health in the nation and were more likely to report being diagnosed with depression than residents of any other state.
Residents in West Virginia also had the lowest score on the Physical Health Index, which includes having the highest percentage of obese residents in the nation. Colorado residents scored the highest on the Physical Health Index, partially a result of having the lowest percentage of obese residents in the U.S.
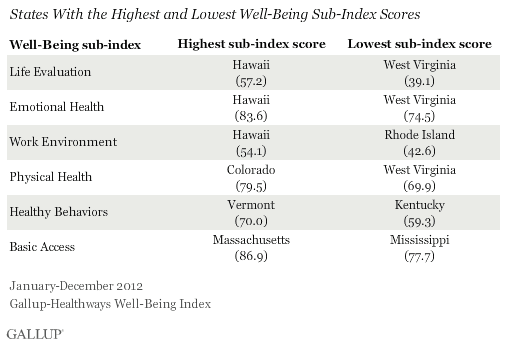
Vermont residents had the healthiest behaviors in the nation, including the highest percentage of residents who ate five or more servings of fruits and vegetables at least four days per week. The Healthy Behaviors Index also measures the percentage of residents who smoke, exercise frequently, and eat healthy daily. Kentucky ranked last on this index, with the lowest percentage of residents in the nation saying they ate healthy all day "yesterday."
Massachusetts residents were most likely to report having access to basic necessities, as they were in 2010 and 2011. This top score is partly a result of having the highest percentage of residents with health insurance in the nation. The Basic Access Index also measures residents' access to other health essentials, including enough money for food, shelter, and medicine; a safe place to exercise; and clean water. Mississippi performed the worst on this metric -- as it has every year since 2008 -- partly a result of having the highest percentage of residents unable to afford food at some point in the past year for themselves or their families.
Bottom Line
Overall well-being in the U.S. and within states has remained mostly unchanged from 2008 to 2012, despite some signs of an improving economy in 2012. The lack of progress among the states with the lowest well-being scores may be related to low household income levels in these states. Nearly all of the states with the lowest well-being scores in 2012 are also states with the lowest median household incomes.
Certain provisions of the Affordable Care Act -- requiring all individuals to have health insurance or to risk paying a penalty -- may help low-income individuals improve their well-being, if they aware of and take advantage of them. Under the Affordable Care Act, all adults with an insurance policy beginning on or after Sept. 23, 2010, are entitled to an obesity screening and counseling, a tobacco screening and cessation intervention, blood pressure screening, and depression screening at no cost. Adults at high risk for certain chronic diseases are also entitled to a free cholesterol screening, Type 2 diabetes screening, and diet counseling. Public education efforts about these initiatives, particularly those targeting low-income Americans, may be essential to helping the states with the lowest well-being to make significant year-over-year improvements.
The private sector can also take steps to help individuals improve their overall well-being. Gallup research shows that physicians in the U.S. are in better health than are other employed adults and Americans who are engaged in their work are more likely to report having a healthier lifestyle. Therefore, physicians can set a positive health example for their patients and employers can focus on creating an engaged workplace to help reduce the economic costs of low well-being. Employers can also establish incentives and policies that encourage their employees to practice healthy behaviors.
Gallup's "State of the States" series reveals state-by-state differences on political, economic, and well-being measures Gallup tracks each day. New stories based on full-year 2012 data will be released throughout the month of February.
About the Gallup-Healthways Well-Being Index
The Gallup-Healthways Well-Being Index tracks well-being in the U.S. and provides best-in-class solutions for a healthier world. To learn more, please visit well-beingindex.com.
Survey Methods
Results are based on telephone interviews conducted as part of the Gallup-Healthways Well-Being Index survey Jan. 1-Dec. 31, 2012, with a random sample of 353,564 adults, aged 18 and older, living in all 50 U.S. states and the District of Columbia, selected using random-digit-dial sampling.
For results based on the total sample of national adults, one can say with 95% confidence that the margin of sampling error is ±1 percentage point.
The margin of sampling error for most states is ±1 to ±2 percentage points, but is as high as ±4 points for states with smaller population sizes such as Alaska, Rhode Island, Vermont, Wyoming, North Dakota, South Dakota, Delaware, and Hawaii.
Interviews are conducted with respondents on landline telephones and cellular phones, with interviews conducted in Spanish for respondents who are primarily Spanish-speaking. Each sample includes a minimum quota of 400 cellphone respondents and 600 landline respondents per 1,000 national adults, with additional minimum quotas among landline respondents by region. Landline telephone numbers are chosen at random among listed telephone numbers. Cellphone numbers are selected using random-digit-dial methods. Landline respondents are chosen at random within each household on the basis of which member had the most recent birthday.
Samples are weighted by gender, age, race, Hispanic ethnicity, education, region, adults in the household, and phone status (cell phone only/landline only/both, cell phone mostly, and having an unlisted landline number). Demographic weighting targets are based on the March 2010 Current Population Survey figures for the aged 18 and older non-institutionalized population living in U.S. telephone households. All reported margins of sampling error include the computed design effects for weighting and sample design.
In addition to sampling error, question wording and practical difficulties in conducting surveys can introduce error or bias into the findings of public opinion polls.
For more details on Gallup's polling methodology, visit https://www.gallup.com/.

