WASHINGTON, D.C. -- The average age at which U.S. retirees say they actually retired is now at 61, up from 57 in the early 1990s.

These results are from Gallup's annual Economy and Personal Finance survey, conducted April 4-14. The average retirement age has crept up by four years over the past two decades, from 57 in 1991 to the current 61. Because most of the uptick came before the 2008 recession, this shift may reflect more than just a changing economy. It may also indicate changing norms about the value of work, the composition of the workforce, the decrease in jobs with mandatory retirement ages, and other factors.
Whereas the average current retiree stopped working at age 61, those still working expect to work well beyond that age. The average nonretired American currently expects to retire at age 66, up from 60 in 1995.
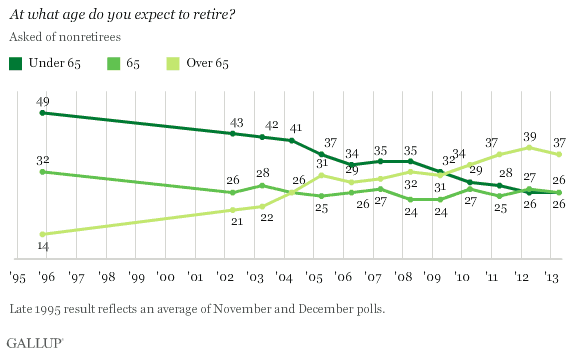
Currently, 37% of nonretired Americans say they expect to retire after age 65, 26% at age 65, and 26% before age 65. The most notable change over time is the increase in those expecting to work past age 65 -- the 37% this year is up from 22% a decade ago and 14% in 1995. Meanwhile, the percentage of nonretirees who say they expect to retire before age 65 has declined to 26% from 49% in 1995.The percentage who say they will retire at exactly 65 has held fairly constant over the decades.

Americans became more likely to say they will retire after age 65 than before that age for the first time in 2010. Since then, the gap has generally widened.
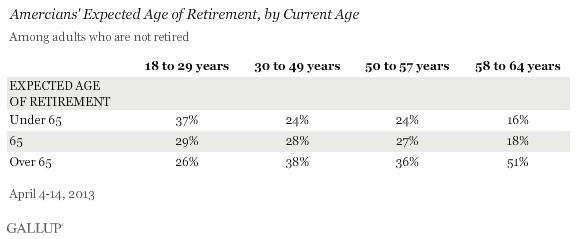
Nonretirees Expect Later Retirement Age as They Get Older
Nonretirees who are closer to age 65 are typically more likely to project a later retirement age than those who are further away from retirement. More than half of nonretirees aged 58 to 64 expect to retire after age 65, compared with 36% of nonretirees aged 50 to 57, 38% of those between 30 and 49, and just 26% of those younger than 30. Retirement accounts of the older group may have declined in value during the economic recession, while the younger group may feel that their retirement accounts' values will be high enough for them to retire at age 65 or younger -- even taking into account the uncertain financial situations of Social Security and Medicare.

Bottom Line
The average age that current U.S. retirees said they retired is now 61, compared with 59 in 2003 and 57 in 1993. It is likely that the average retirement age will continue to increase in the years ahead, as more nonretirees expect to delay their retirement past age 65.
Americans' biggest financial concern is funding their retirement, with 61% saying they are worried about having enough money for it. Thus, postponing retirement could help Americans save enough money to live comfortably.
Americans may also get a health perk from delaying their retirement. Gallup has found that Americans aged 60 to 69 who work have slightly better emotional health than those who do not work, and this relationship is stronger for Americans in fair or poor health.
Survey Methods
Results for this Gallup poll are based on telephone interviews conducted April 4-14, 2013, with a random sample of 2,017 adults, aged 18 and older, living in all 50 U.S. states and the District of Columbia.
For results based on the total sample of national adults, one can say with 95% confidence that the margin of sampling error is ±3 percentage points.
For results based on the sample of 636 retirees, the margin of sampling error is ±5 percentage points.
For results based on the sample of 1,381 nonretirees, the margin of sampling error is ±3 percentage points.
Interviews are conducted with respondents on landline telephones and cellular phones, with interviews conducted in Spanish for respondents who are primarily Spanish-speaking. Each sample of national adults includes a minimum quota of 50% cellphone respondents and 50% landline respondents, with additional minimum quotas by region. Landline telephone numbers are chosen at random among listed telephone numbers. Cellphone numbers are selected using random digit dial methods. Landline respondents are chosen at random within each household on the basis of which member had the most recent birthday.
Samples are weighted to correct for unequal selection probability, nonresponse, and double coverage of landline and cell users in the two sampling frames. They are also weighted to match the national demographics of gender, age, race, Hispanic ethnicity, education, region, population density, and phone status (cellphone only/landline only/both, cellphone mostly, and having an unlisted landline number). Demographic weighting targets are based on the March 2012 Current Population Survey figures for the aged 18 and older U.S. population. Phone status targets are based on the July-December 2011 National Health Interview Survey. Population density targets are based on the 2010 census. All reported margins of sampling error include the computed design effects for weighting.
In addition to sampling error, question wording and practical difficulties in conducting surveys can introduce error or bias into the findings of public opinion polls.
View methodology, full question results, and trend data.
For more details on Gallup's polling methodology, visit www.gallup.com.
