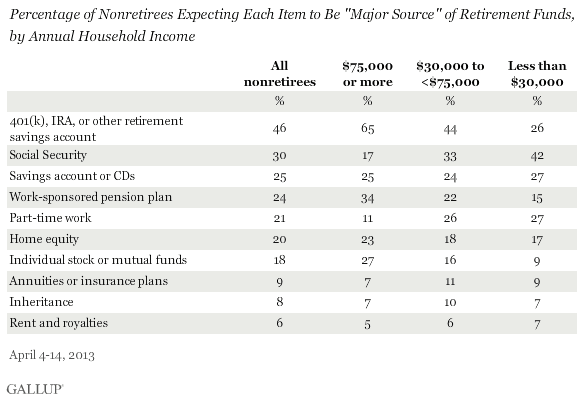
PRINCETON, NJ -- Nonretired Americans' expectations about which sources they will rely on to fund their retirement differ significantly by their annual household income. Upper-income nonretirees are much more likely to say investments, such as a 401(k), IRA and other retirement savings accounts or individual stock investments, and work-sponsored pension plans will be major sources of their retirement income. In contrast, lower-income respondents are more likely to say Social Security and part-time work will be major sources.

Among all U.S. nonretirees, 401(k) plans and IRAs -- at 46% -- are the most commonly expected "major source" of retirement funds, followed by Social Security (30%), savings accounts or CDs (25%), and pension plans (24%). Gallup has tracked these expectations since 2001, and self-directed retirement accounts such as 401(k) plans and Social Security have been the leading expected sources each year, with only minor variations in the year-to-year percentages for each. However, expected retirement sources of current and future retirees differ.
The results are based on Gallup's annual Economy and Personal Finance poll, conducted April 4-14 with a sample of more than 2,000 adults, including more than 1,300 nonretirees. The larger sample allows for a more detailed analysis of retirement expectations by subgroup. Gallup finds the greatest differences in how nonretirees expect to pay for their retirement by income and age.
Sixty-five percent of upper-income Americans expect a self-directed retirement account, such as a 401(k) or IRA, to be a major source of retirement funds. That drops to 44% of middle-income respondents and 26% of lower-income respondents.
The opposite pattern exists on Social Security, with 42% of lower-income nonretirees saying it will be a major source of their retirement funds, compared with 17% of upper-income nonretirees.
The rank order of expected resources by household income reveals how nonretired Americans' current financial resources influence their views of how they will pay for retirement. Social Security and part-time work -- two sources middle- and lower-income nonretirees say will be a major source of their retirement funds -- do not figure among the main funding sources for upper-income respondents.

The Young Aren't Counting on Social Security
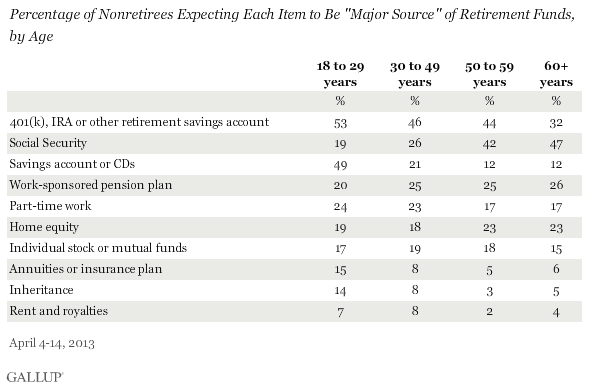
In addition to income, one's current age appears to significantly influence one's retirement outlook. The main age distinction involves younger nonretirees' greater expected reliance on retirement investment accounts such as 401(k)s and IRAs, and older nonretirees' greater expected reliance on Social Security.

The differences by age may largely reflect the changing nature of retirement funding, including the uncertain future of the Social Security system. Gallup has found that only about one in five young adults expect to receive a Social Security benefit when they retire. And even if they do receive a benefit, potential reforms to Social Security may require today's younger workers to wait until a later age to get full benefits or to get a proportionately smaller benefit than today's retirees. Thus, young respondents are looking to sources outside of Social Security to support them after they stop working.
Meanwhile, those nearing retirement age today still see Social Security as having a major role in funding their retirement -- it is essentially tied with 401(k) plans as the top source among 50- to 59-year-old nonretirees, and is the top-rated source among nonretirees aged 60 and older.
Self-directed retirement plans, such as 401(k)s and IRAs, are the top source among nonretirees younger than 50 by a wide margin over other possible sources.
Notably, there are not large differences by age in the percentage who expect to rely on a work-sponsored pension plan, which had been a common employee benefit in the past. Many employers have replaced these with 401(k) plans in recent years.
Nonretirees younger than 30 are more likely than older nonretirees to expect to rely on a variety of sources, including savings accounts, an inheritance, or annuities or insurance to pay for their retirement. The reasons for that are unclear; perhaps younger nonretirees consciously want to pursue a more diverse set of funding options for retirement to compensate for the expected absence of Social Security as a major retirement funding source.
Implications
While retirement is a reality for all Americans who reach an advanced age, how they plan to pay for it largely depends on their current financial resources and the number of years they have left until retirement. Wealthier Americans, who have more income at their disposal, are primarily looking to support themselves in retirement with investments. Meanwhile, less wealthy Americans are much more likely to expect to rely on the Social Security system and part-time work to fund their retirements. Additionally, younger Americans, who are dubious about receiving Social Security benefits, are expecting to rely on a more varied group of sources to support themselves in retirement.
Government and business leaders thus have important roles in helping Americans to become financially stable in retirement. Both can continue to encourage American workers to save for retirement through 401(k) and, to a lesser extent, pension plans. However, support and encouragement are likely not enough for lower-income Americans, who generally lack the financial wherewithal to invest, or invest significantly, in retirement accounts. Thus, a key for government leaders is to find solutions that will keep the Social Security system solvent -- for current retirees and near-retirees who do or will rely a great deal on it, as well as for lower-income Americans in future generations who cannot reasonably expect to adequately fund their retirements by saving and investing during their working years.
Survey Methods
Results for this Gallup poll are based on telephone interviews conducted April 4-14, 2013, with a random sample of 2,017 adults, aged 18 and older, living in all 50 U.S. states and the District of Columbia.
For results based on the total sample of national adults, one can say with 95% confidence that the margin of sampling error is ±3 percentage points.
For results based on the total sample of 1,381 nonretirees, one can say with 95% confidence that the margin of sampling error is ±3 percentage points.
For results based on the total sample of 636 retirees, one can say with 95% confidence that the margin of sampling error is ±5 percentage points.
Interviews are conducted with respondents on landline telephones and cellular phones, with interviews conducted in Spanish for respondents who are primarily Spanish-speaking. Each sample of national adults includes a minimum quota of 50% cellphone respondents and 50% landline respondents, with additional minimum quotas by region. Landline telephone numbers are chosen at random among listed telephone numbers. Cellphone numbers are selected using random digit dial methods. Landline respondents are chosen at random within each household on the basis of which member had the most recent birthday.
Samples are weighted to correct for unequal selection probability, nonresponse, and double coverage of landline and cell users in the two sampling frames. They are also weighted to match the national demographics of gender, age, race, Hispanic ethnicity, education, region, population density, and phone status (cellphone only/landline only/both, cellphone mostly, and having an unlisted landline number). Demographic weighting targets are based on the March 2012 Current Population Survey figures for the aged 18 and older U.S. population. Phone status targets are based on the July-December 2011 National Health Interview Survey. Population density targets are based on the 2010 census. All reported margins of sampling error include the computed design effects for weighting.
In addition to sampling error, question wording and practical difficulties in conducting surveys can introduce error or bias into the findings of public opinion polls.
View methodology, full question results, and trend data.
For more details on Gallup's polling methodology, visit www.gallup.com.
