WASHINGTON, D.C. -- The adult obesity rate in the U.S. thus far in 2013, at 27.1%, is on pace to surpass rates in prior years. It is up from 26.2% in 2012 and much higher than the 25.5% found in 2008.
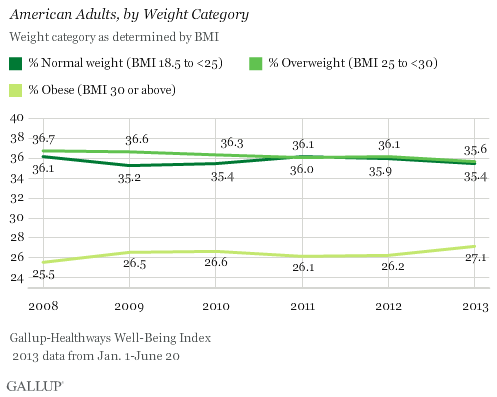
This uptick in obesity is accompanied by slight declines in the percentage of Americans who are classified as overweight and normal weight. The percentage who are overweight fell to 35.6% so far this year from 36.1% in 2012, while the percentage who are a normal weight slipped to 35.4% from 35.9% in 2012.
Gallup and Healthways began tracking Americans' weight in 2008. The 2013 data are based on more than 84,000 interviews conducted from Jan. 1 through June 20 as part of the Gallup-Healthways Well-Being Index. Gallup uses respondents' self-reported height and weight to calculate body mass index (BMI) scores. Individual BMI values of 30 or above are classified as "obese," 25 to 29.9 are "overweight," 18.5 to 24.9 are "normal weight," and 18.4 or less are "underweight."
Bottom Line
The upward trend in obesity thus far in 2013 reverses the lower levels found in 2011 and 2012. One possible reason why obesity has increased is that fewer Americans are exercising frequently, in 2013 compared with 2012. Gallup has found that exercising three days per week for 30 minutes per day is closely linked to having a lower BMI.
The American Medical Association on Tuesday officially recognized obesity as a disease, which could have implications for the way physicians, insurance companies, and the general population perceive and treat it. This decision, although controversial, could bring new resources to help with this significant public health problem, which affects more Americans now than it has at any time in the past five years. By classifying obesity as a disease, physicians may be more comfortable addressing the problem of obesity with their patients. At the same time, it could encourage more Americans to rely on complex and expensive medical procedures and treatments, rather than taking steps to lower their weight through exercise, healthy eating, and other lifestyle changes.
About the Gallup-Healthways Well-Being Index
The Gallup-Healthways Well-Being Index tracks well-being in the U.S. and provides best-in-class solutions for a healthier world. To learn more, please visit well-beingindex.com.
Survey Methods
Results are based on telephone interviews conducted as part of the Gallup-Healthways Well-Being Index survey Jan. 1-June 20, 2013, with a random sample of 84,463 adults, aged 18 and older, living in all 50 U.S. states and the District of Columbia.
For results based on the total sample of national adults, one can say with 95% confidence that the margin of sampling error is ±1 percentage points.
Interviews are conducted with respondents on landline telephones and cellular phones, with interviews conducted in Spanish for respondents who are primarily Spanish-speaking. Each sample of national adults includes a minimum quota of 50% cell phone respondents and 50% landline respondents, with additional minimum quotas by region. Landline telephone numbers are chosen at random among listed telephone numbers. Cell phones numbers are selected using random digit dial methods. Landline respondents are chosen at random within each household on the basis of which member had the most recent birthday.
Samples are weighted to correct for unequal selection probability, nonresponse, and double coverage of landline and cell users in the two sampling frames. They are also weighted to match the national demographics of gender, age, race, Hispanic ethnicity, education, region, population density, and phone status (cellphone only/landline only/both, cellphone mostly, and having an unlisted landline number). Demographic weighting targets are based on the March 2012 Current Population Survey figures for the aged 18 and older U.S. population. Phone status targets are based on the July-December 2011 National Health Interview Survey. Population density targets are based on the 2010 census. All reported margins of sampling error include the computed design effects for weighting.
In addition to sampling error, question wording and practical difficulties in conducting surveys can introduce error or bias into the findings of public opinion polls.
For more details on Gallup's polling methodology, visit www.gallup.com.
